Loading…
Sec 4 · G1 (N(T))
Statistics
Practise statistics with step-by-step help. Free account.
1. Cumulative frequency
| Marks | Frequency | Cumulative frequency |
|---|---|---|
📖 Worked example
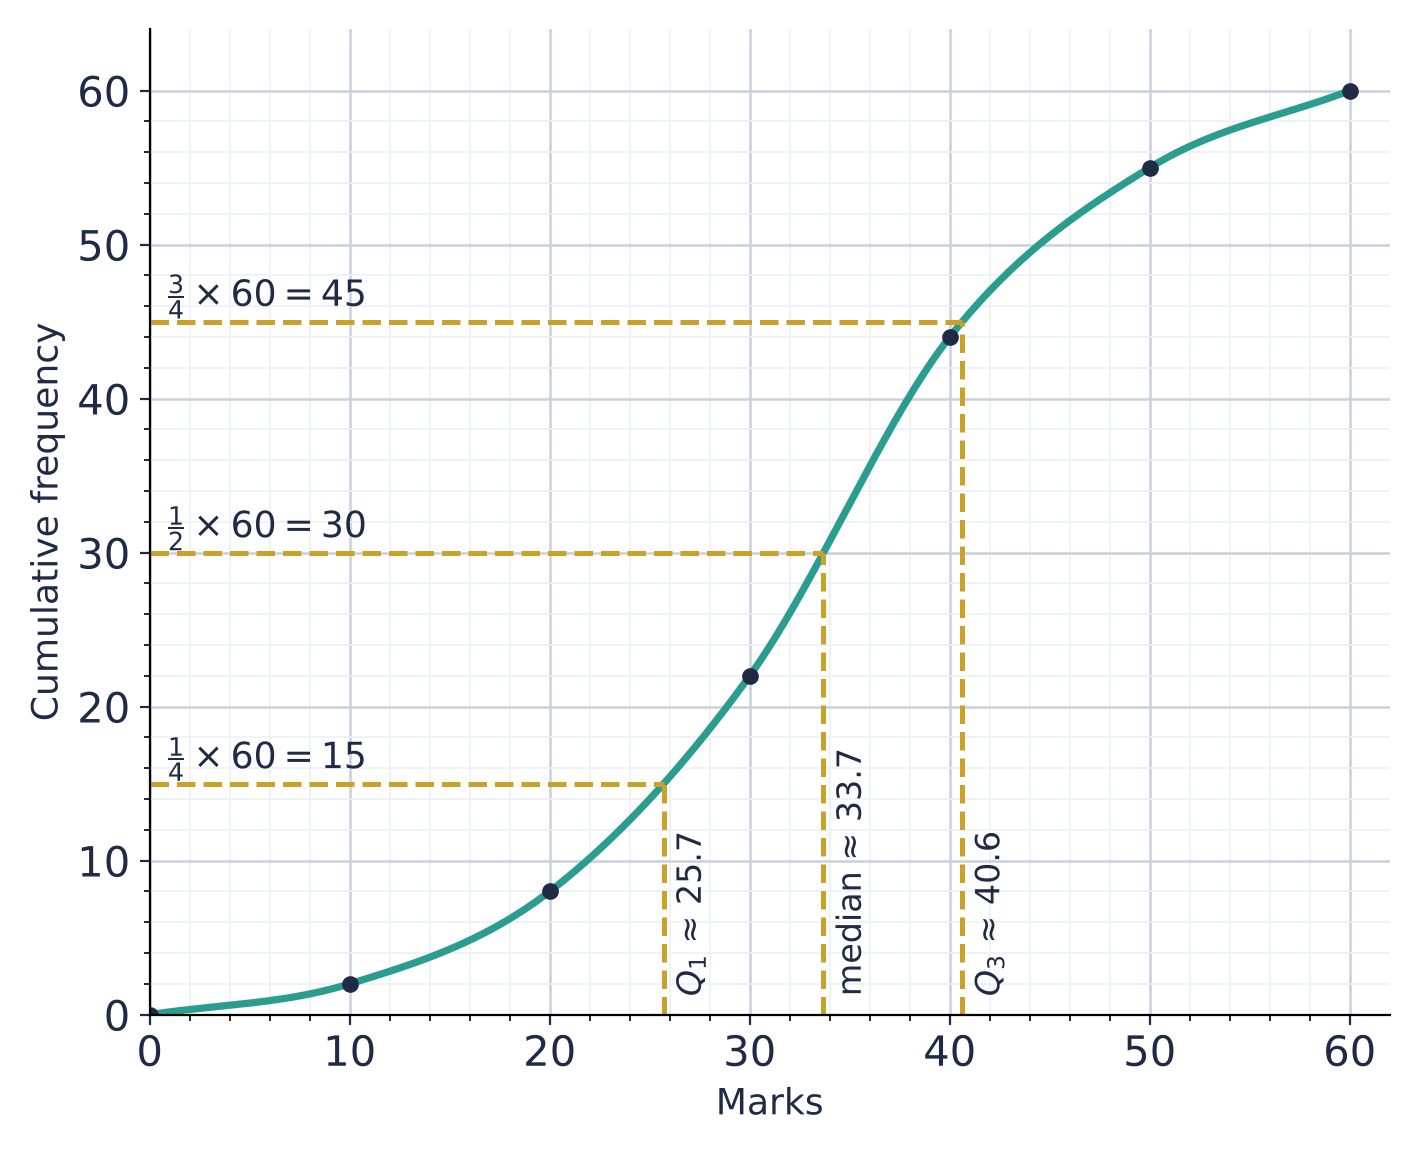
The cumulative frequency curve shows the marks of students in a test. Use the curve to estimate the number of students who scored more than marks.
Step 1 of 2
Go up from the mark on the horizontal axis to the curve, then across
The curve gives about students with at most marks.
2. Median, quartiles and percentiles
| From a curve ( values) | Read across from | Here |
|---|---|---|
| lower quartile | , so | |
| median | , so | |
| upper quartile | , so | |
| interquartile range | ||
| th percentile | 80th: across from |
From a list: 39, 42, 44, 46, 48, 50, 52, 55, 57, 61
- median: between the 5th and 6th, , so
- lower half :
- upper half :
📖 Worked example
The cumulative frequency curve shows the marks of students. Use the curve to estimate the median mark.
Step 1 of 2
Which cumulative frequency do you go across from?
Practise statistics with step-by-step help
Endless questions from basic to exam level. Get one wrong and see where it went wrong. Free account.