Loading…
Sec 4 · G3 (Express)
Statistics
Practise statistics with step-by-step help. Free account.
1. Cumulative frequency
| Marks | Frequency | Cumulative frequency |
|---|---|---|
📖 Worked example
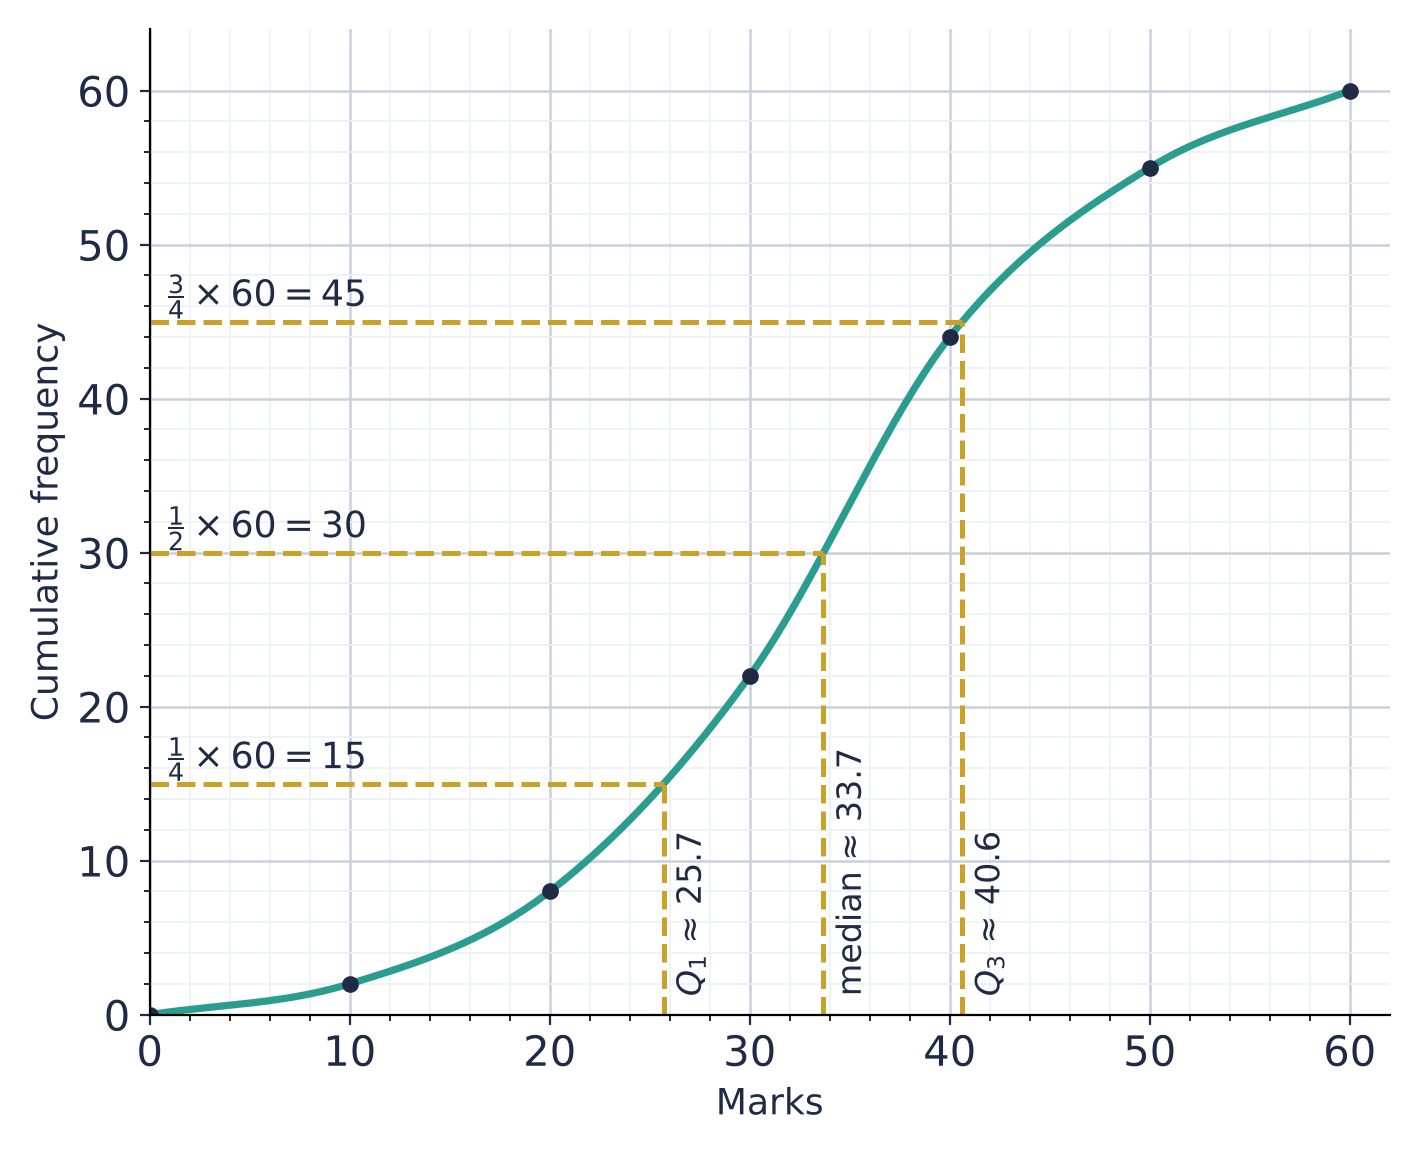
The cumulative frequency curve shows the marks of students in a test. Use the curve to estimate the number of students who scored more than marks.
Step 1 of 2
Go up from the mark on the horizontal axis to the curve, then across
The curve gives about students with at most marks.
2. Median, quartiles and percentiles
| From a curve ( values) | Read across from | Here |
|---|---|---|
| lower quartile | , so | |
| median | , so | |
| upper quartile | , so | |
| interquartile range | ||
| th percentile | 80th: across from |
From a list: 39, 42, 44, 46, 48, 50, 52, 55, 57, 61
- median: between the 5th and 6th, , so
- lower half :
- upper half :
📖 Worked example
The cumulative frequency curve shows the marks of students. Use the curve to estimate the median mark.
Step 1 of 2
Which cumulative frequency do you go across from?
| Asked | On the curve |
|---|---|
| percentage scoring or fewer | up from , across: reading |
| with | across from , then down |
📖 Worked example
The cumulative frequency curve shows the marks of students. The probability that a student chosen at random scored more than marks is . Use the curve to estimate .
Step 1 of 3
Turn the probability into a number of students
More than marks: students
3. Box-and-whisker plots
| Measure | Formula | Here |
|---|---|---|
| range | max min | , so |
| interquartile range | , so |
📖 Worked example
The box-and-whisker plots show the times, in minutes, taken by two groups, and . Find the difference between their medians.
Step 1 of 2
Read each plot
: , , , , : , , , ,
📖 Worked example
The box-and-whisker plot shows the times, in minutes, that some students took to finish a task. of the students took less than minutes. Find the number of students who did the task.
Step 1 of 2
The lower whisker (minimum to Q1 = 20) holds a quarter of the data
A quarter of the students took less than minutes.
4. Mean and standard deviation
| List | Frequency table | |
|---|---|---|
| mean | ||
| standard deviation | ||
| or |
30, 34, 35, 39, 42: Σx = 180, Σx² = 6566
e.g.
The same data, the other way: mean 36
e.g.
📖 Worked example
The table shows the marks of students. Using the mid-values of the classes, estimate the mean mark, correct to 3 significant figures.
| Marks, | Frequency |
|---|---|
| 2 | |
| 6 | |
| 14 | |
| 22 | |
| 11 | |
| 5 |
Step 1 of 2
Use the mid-values x with the frequencies f
| Every value | Mean | Standard deviation |
|---|---|---|
| or | or | unchanged |
📖 Worked example
The mean and the standard deviation of the marks of a class in a test are marks and marks. Every student is then given extra marks for a question that was marked wrongly. Write down the new standard deviation.
Step 1 of 2
Moving every value by the same amount moves the mean, but the spread about it does not change
The standard deviation stays the same.
5. Comparing two data sets
| Compare | Meaning |
|---|---|
| mean or median | larger: the values are higher on average (say what that means, e.g. better marks, or took longer) |
| standard deviation or IQR | smaller: more consistent (less spread out) |
📖 Worked example
The numbers of books read by some students in two classes are shown. Class : . Class : . Which class's numbers of books read were more consistent?
Step 1 of 4
Which measure answers the question?
More consistent means less spread: the smaller standard deviation.
Try a question: Statistics
Free · no sign-upAnswer a real practice question. Get it wrong and MugCorner shows you where it went wrong, with hints and a step-by-step guide.
Practise statistics with step-by-step help
Endless questions from basic to exam level. Get one wrong and see where it went wrong. Free account.