Loading…
Sec 1 · G2 (N(A))
Statistics
Practise statistics with step-by-step help. Free account.
1. Collecting and organising data
| Mode of transport | Tally | Frequency |
|---|---|---|
| Bus | ||
| MRT | ||
| Car | ||
| Walk | ||
| Total |
📖 Worked example
The bar graph shows the favourite hawker food of a class. Find how many more pupils there are for Satay than for Nasi lemak.
Step 1 of 2
Work out what one small division stands for, then read the two bars
One small division stands for .Satay: ; Nasi lemak:
2. Pie charts and bar graphs
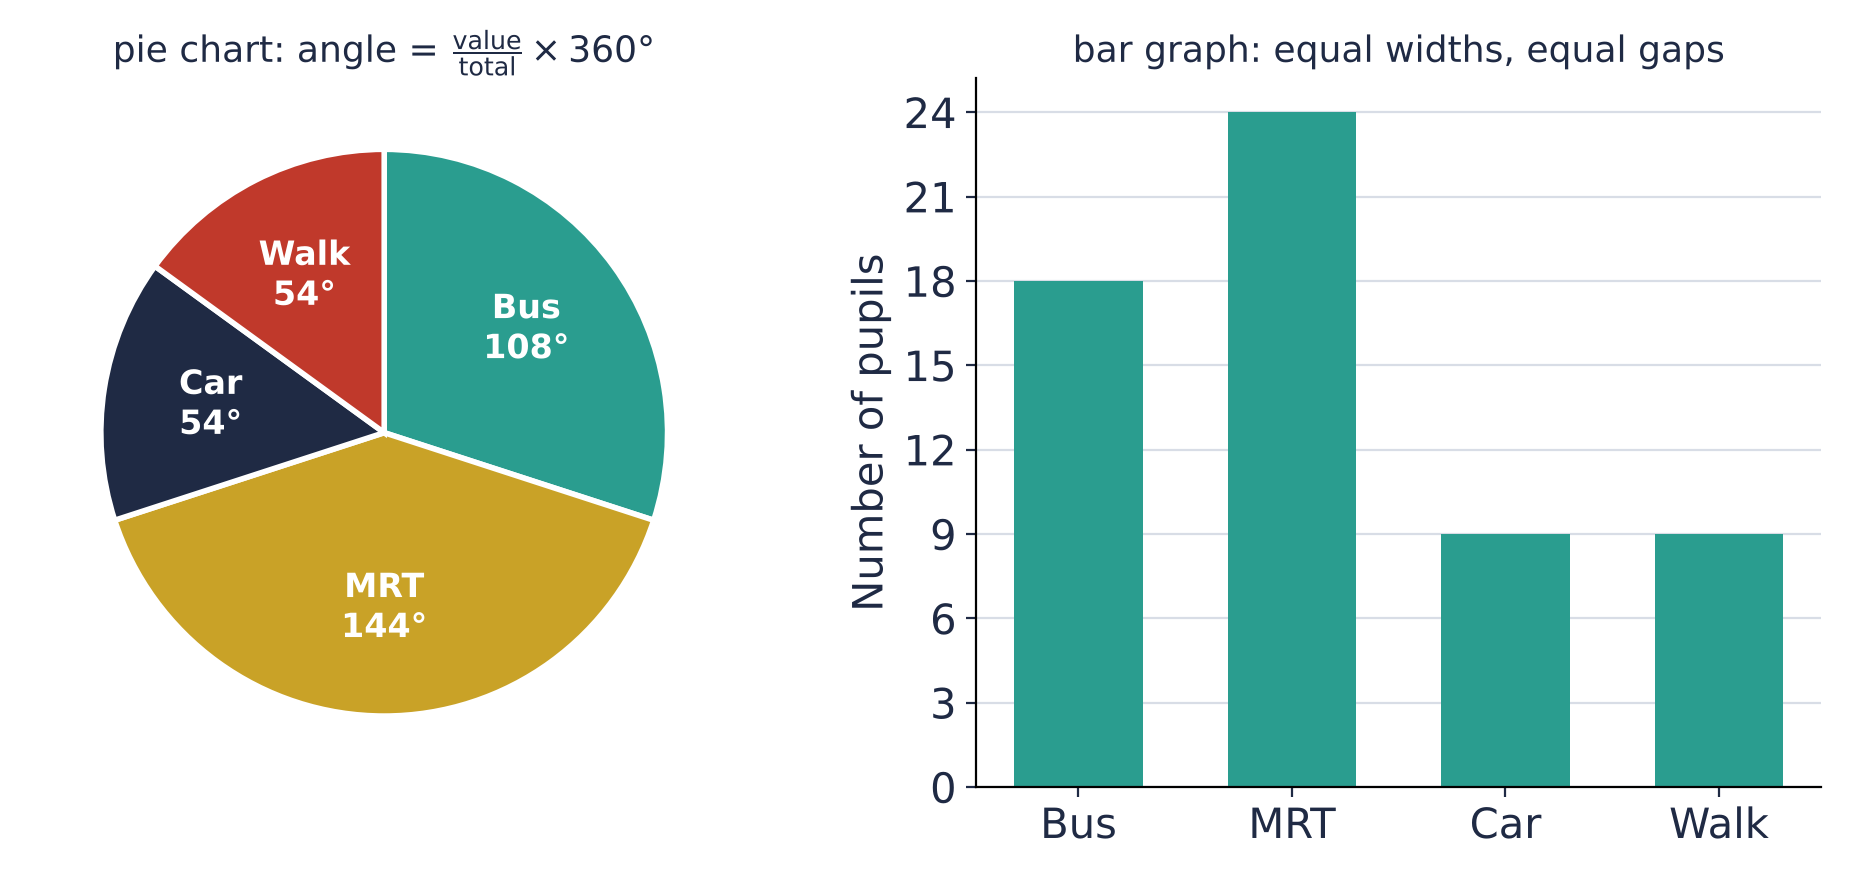
Angle for Bus: 18 out of 60
e.g.
From an angle back to a number: Car is 54°
e.g.
📖 Worked example
The table shows the CCAs chosen by Secondary 1 pupils. The information is to be shown in a pie chart. Calculate the angle of the sector for Uniformed.
| Item | Uniformed | Sports | Arts | Clubs |
|---|---|---|---|---|
| Number of pupils | 42 | 27 | 32 | 19 |
Step 1 of 2
Find the total
📖 Worked example
The line graph shows the monthly sales of a bubble tea shop. Find the sales in Apr.
Step 1 of 1
Work out what one small division stands for. Go up from Apr to the line, then across to the axis
At Apr, the sales was thousand cups.
3. Misleading graphs
| Look for | Why it misleads |
|---|---|
| vertical axis not starting at | small differences look large |
| picture made wider and taller | doubling both makes the area times |
| uneven gaps on a time axis | the rate of change is distorted: equal distances on the axis are not equal times |
| bars of different widths | the wider bar looks bigger |
| no key or scale | values cannot be read |
📖 Worked example
The number of cars sold went up from in 2019 to in 2023, which is times as many. The artist drew the 2023 picture times as tall and times as wide as the 2019 picture. The area of the 2023 picture is times the area of the 2019 picture. Find the value of .
Step 1 of 1
Area grows with BOTH the height and the width
The picture looks times as big, though the number is only times as large.
4. Choosing a statistical diagram
| Diagram | Best for | Limitation |
|---|---|---|
| Pictogram | small counts, shown with pictures and a key | part of a symbol is hard to read exactly |
| Bar graph | comparing separate categories | does not show each part's share of the whole |
| Line graph | change over time (the trend) | values between the plotted points are only estimates |
| Pie chart | each part as a share of the whole | no actual numbers unless the total is given |
📖 Worked example
The pie chart shows the fruit sold at a stall. Which statement does the pie chart support?
Step 1 of 2
Check each statement against the diagram: true, false or can't tell
The Oranges and Apples sectors together are more than half of the pie. against . True.There are 28 fruits for Apples. The total is not given: a pie chart alone gives fractions of the whole but not numbers. Can't tell.There are 84 fruits for Apples. The total is not given: a pie chart alone gives fractions of the whole but not numbers. Can't tell.The Durians and Mangoes sectors together are more than half of the pie. against . False.
Practise statistics with step-by-step help
Endless questions from basic to exam level. Get one wrong and see where it went wrong. Free account.