Loading…
Sec 1 · G1 (N(T))
Statistics
Practise statistics with step-by-step help. Free account.
1. Collecting and organising data
| Mode of transport | Tally | Frequency |
|---|---|---|
| Bus | ||
| MRT | ||
| Car | ||
| Walk | ||
| Total |
📖 Worked example
The bar graph shows the favourite hawker food of a class. Find how many more pupils there are for Satay than for Nasi lemak.
Step 1 of 2
Work out what one small division stands for, then read the two bars
One small division stands for .Satay: ; Nasi lemak:
2. Pie charts and bar graphs
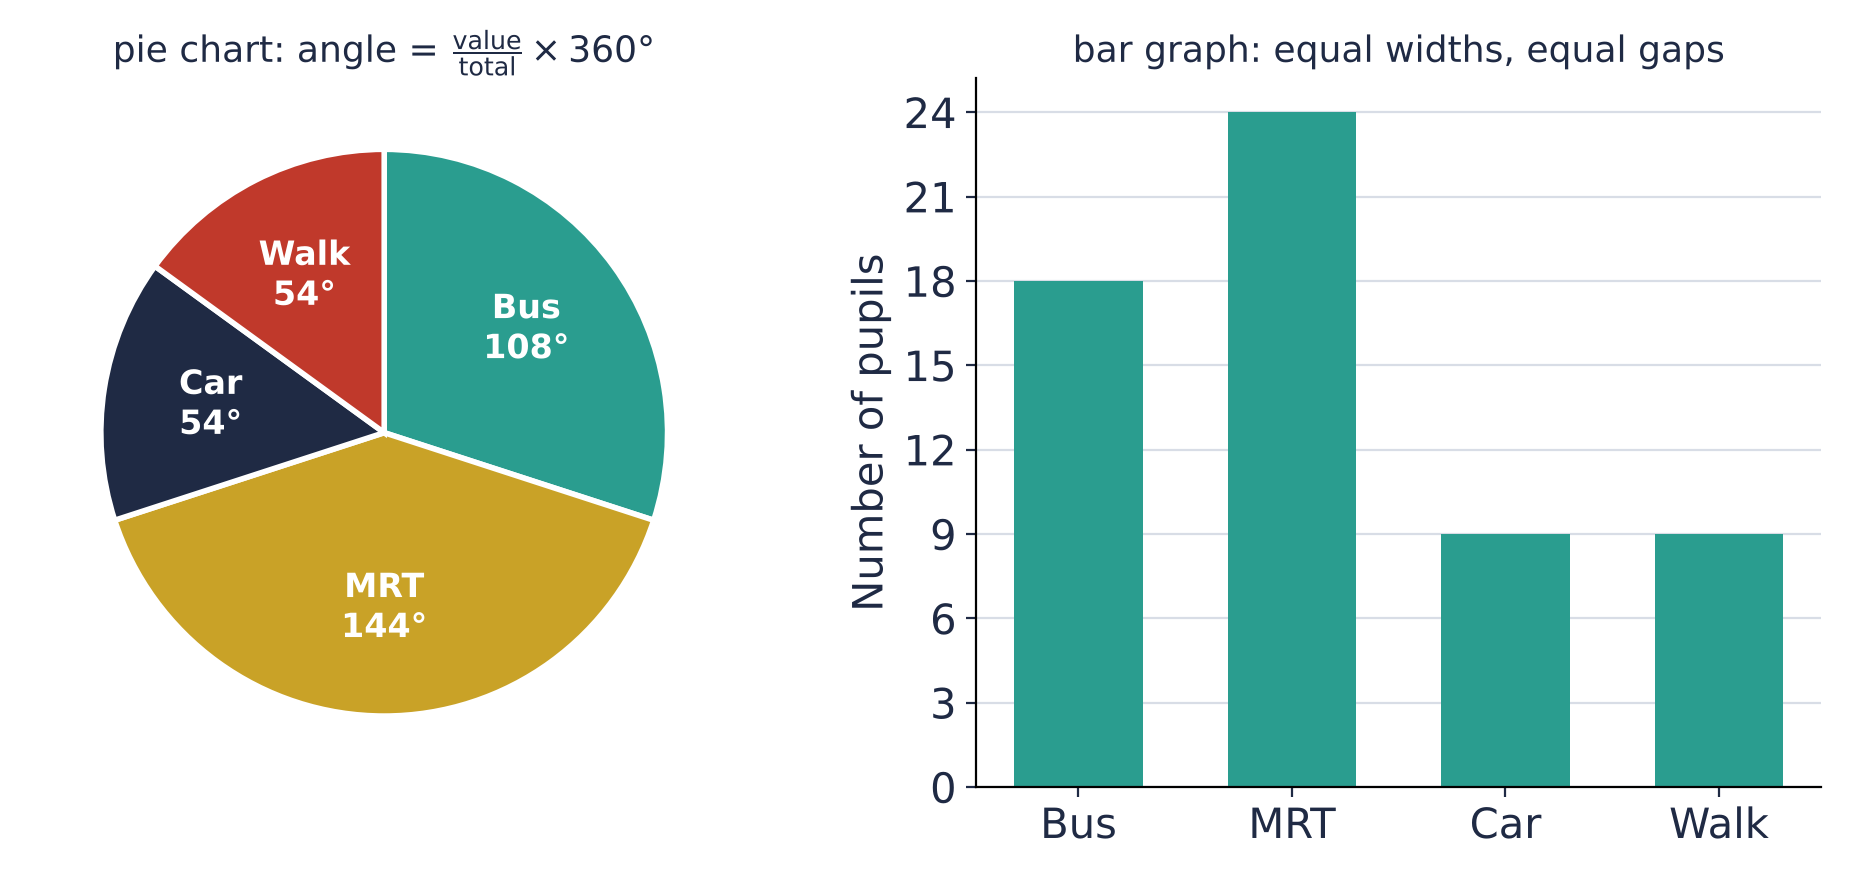
Angle for Bus: 18 out of 60
e.g.
From an angle back to a number: Car is 54°
e.g.
📖 Worked example
The table shows the CCAs chosen by Secondary 1 pupils. The information is to be shown in a pie chart. Calculate the angle of the sector for Uniformed.
| Item | Uniformed | Sports | Arts | Clubs |
|---|---|---|---|---|
| Number of pupils | 42 | 27 | 32 | 19 |
Step 1 of 2
Find the total
📖 Worked example
The line graph shows the monthly sales of a bubble tea shop. Find the sales in Apr.
Step 1 of 1
Work out what one small division stands for. Go up from Apr to the line, then across to the axis
At Apr, the sales was thousand cups.
3. Choosing a statistical diagram
| Diagram | Best for | Limitation |
|---|---|---|
| Pictogram | small counts, shown with pictures and a key | part of a symbol is hard to read exactly |
| Bar graph | comparing separate categories | does not show each part's share of the whole |
| Line graph | change over time (the trend) | values between the plotted points are only estimates |
| Pie chart | each part as a share of the whole | no actual numbers unless the total is given |
📖 Worked example
The pie chart shows the fruit sold at a stall. Which statement does the pie chart support?
Step 1 of 2
Check each statement against the diagram: true, false or can't tell
The Oranges and Apples sectors together are more than half of the pie. against . True.There are 28 fruits for Apples. The total is not given: a pie chart alone gives fractions of the whole but not numbers. Can't tell.There are 84 fruits for Apples. The total is not given: a pie chart alone gives fractions of the whole but not numbers. Can't tell.The Durians and Mangoes sectors together are more than half of the pie. against . False.
Practise statistics with step-by-step help
Endless questions from basic to exam level. Get one wrong and see where it went wrong. Free account.