Loading…
Sec 3 · G3 (Express)
Graphs of functions
Practise graphs of functions with step-by-step help. Free account.
1. Cubic, reciprocal and exponential graphs
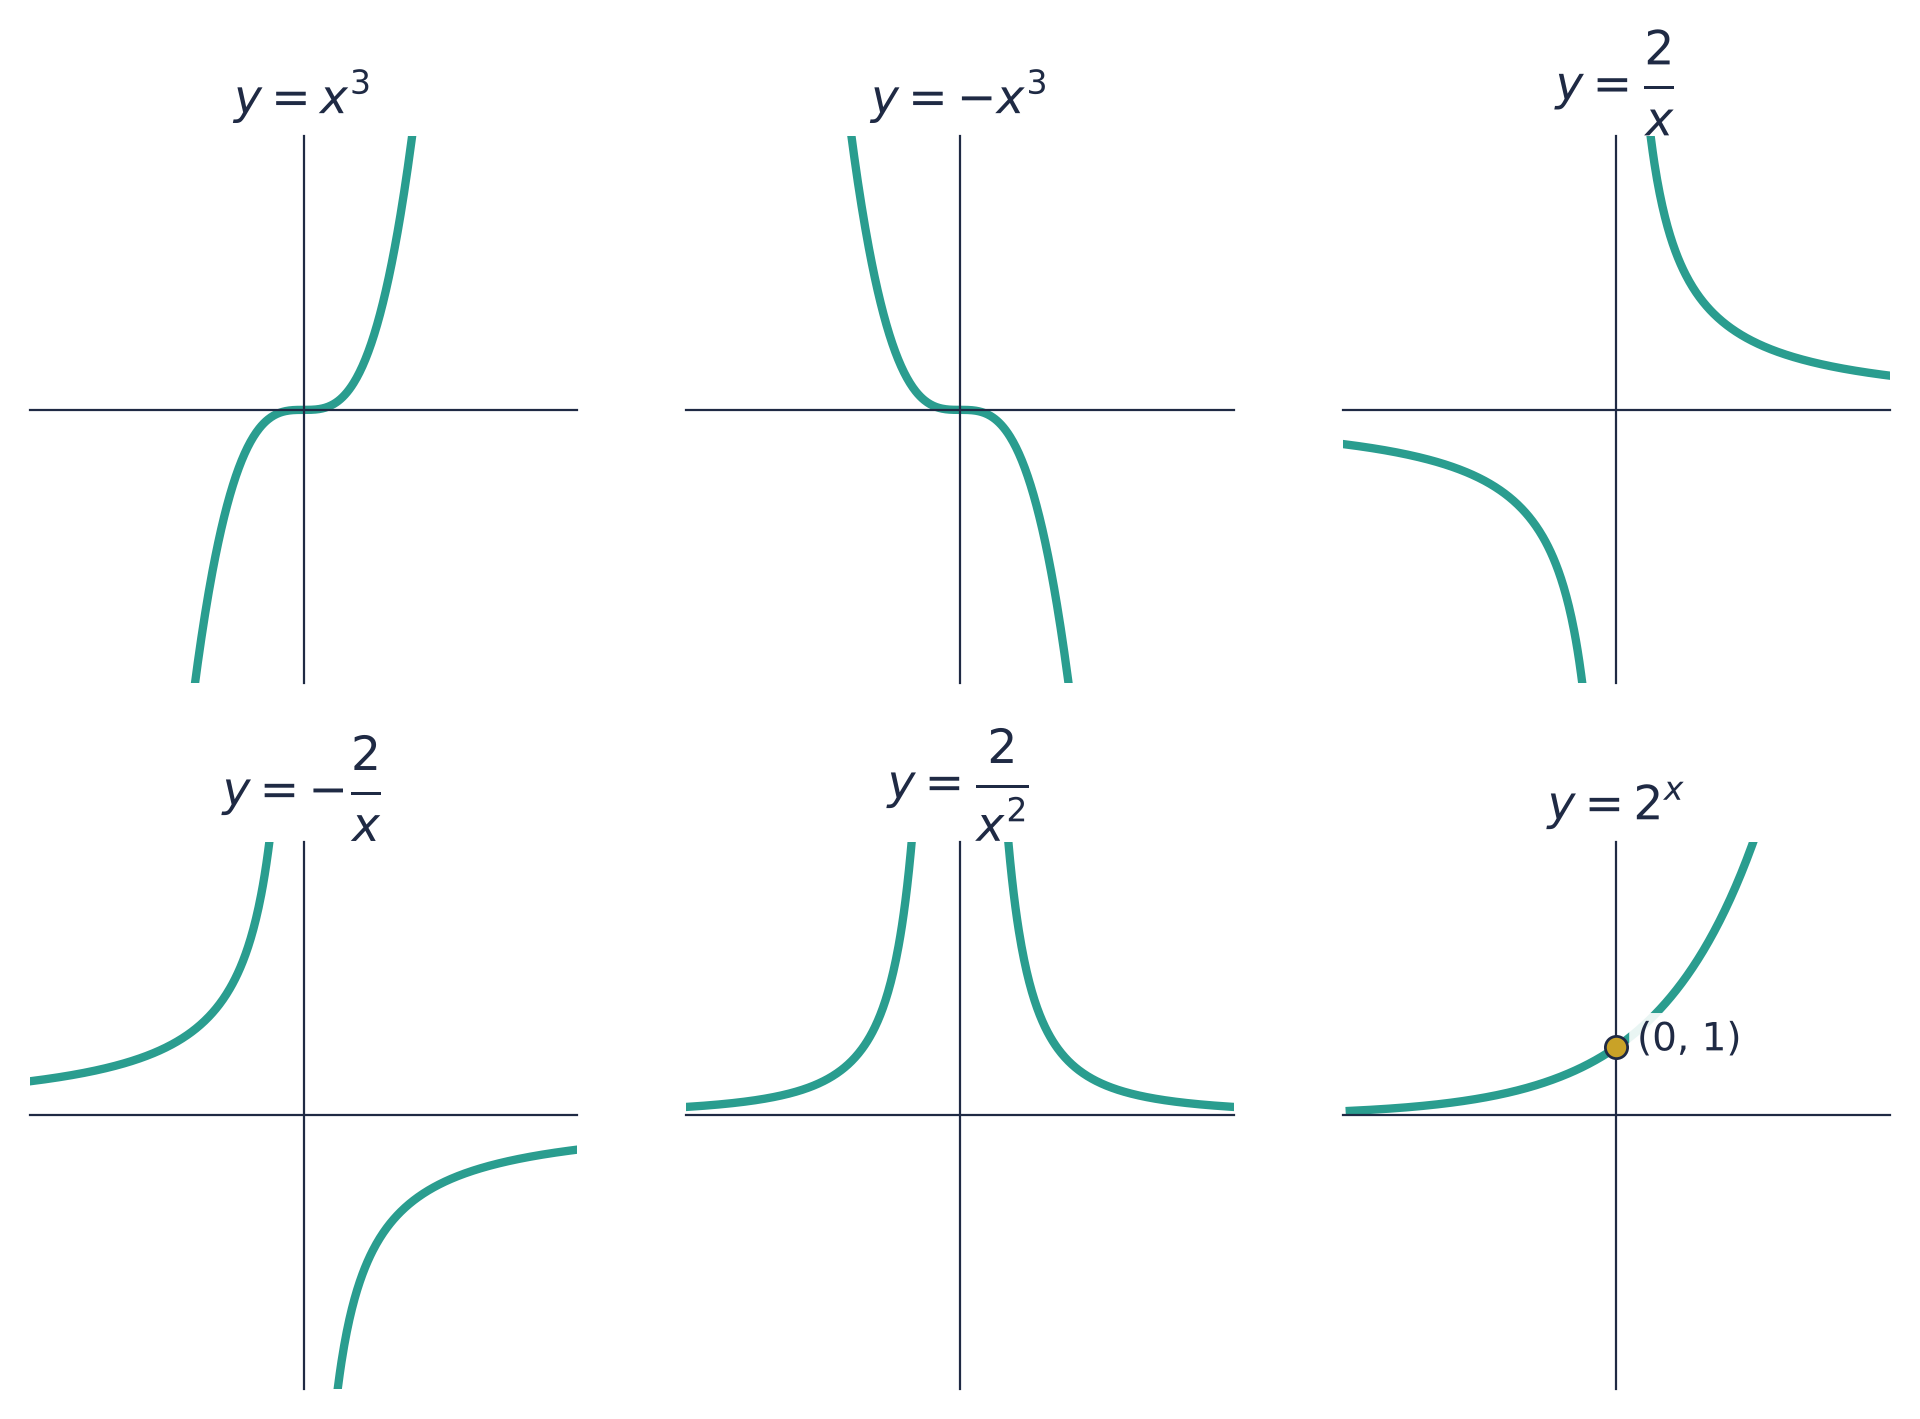
| Graph | Shape |
|---|---|
| : rises; : falls | |
| up to two turning points; right-hand end goes up if , down if | |
| two branches; never meets either axis | |
| two branches, both on the same side of the -axis | |
| crosses the -axis at ; never meets the -axis |
Table of values: substitute each x
e.g.
Reciprocal
e.g.
Exponential
e.g.
A point on the curve: substitute to find k
e.g.
📖 Worked example
Given that , calculate the value of when , correct to 1 decimal place.
Step 1 of 2
Substitute the given value of x and work it out
📖 Worked example
The number of fish in a pond after months is . Find the number of fish after 2 months.
Step 1 of 2
Substitute the given value of t
📖 Worked example
Which diagram, A, B, C or D, shows the graph of ?
Step 1 of 3
What type of graph is it?
is reciprocal ().
| Water poured in steadily: container | Depth against time |
|---|---|
| same width all the way up | a straight line |
| gets wider going up | rises quickly, then more slowly |
| gets narrower going up | rises slowly, then more quickly |
| wide part, then narrow part | two straight pieces: gentle, then steep |
| narrow part, then wide part | two straight pieces: steep, then gentle |
📖 Worked example
Water is poured at a constant rate into the empty container shown, which is open at the top. Which graph, A, B, C or D, shows how the depth of the water, cm, changes with time, seconds? (Each graph has going up and going across.)
Step 1 of 3
How does the container's width change going up?
The container gets narrower going up.
2. Gradient of a curve
Gradient of the curve at P = gradient of the tangent at P
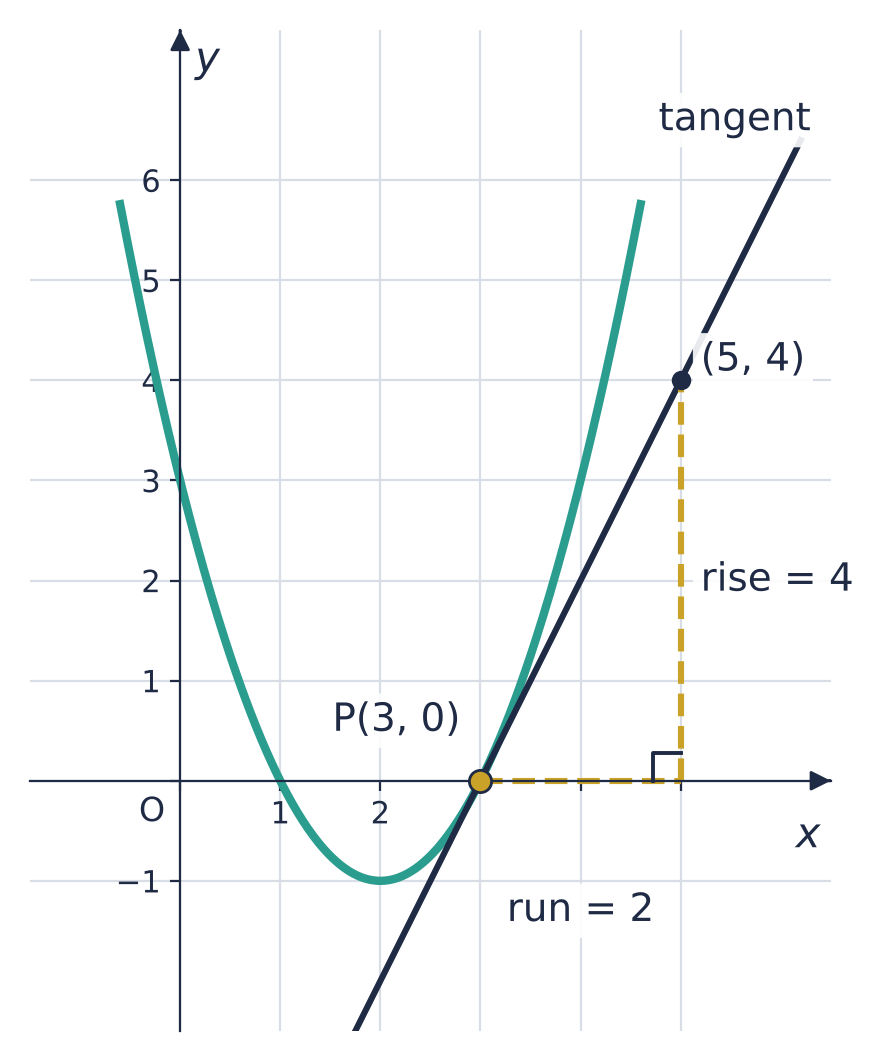
e.g.
- two points on the tangent:
📖 Worked example
The diagram shows the curve and the tangent to the curve at . Use the two points marked on the tangent to find the gradient of the curve at .
Step 1 of 2
Take the two points on the tangent
,
3. Solving equations graphically
Where the curve meets the line
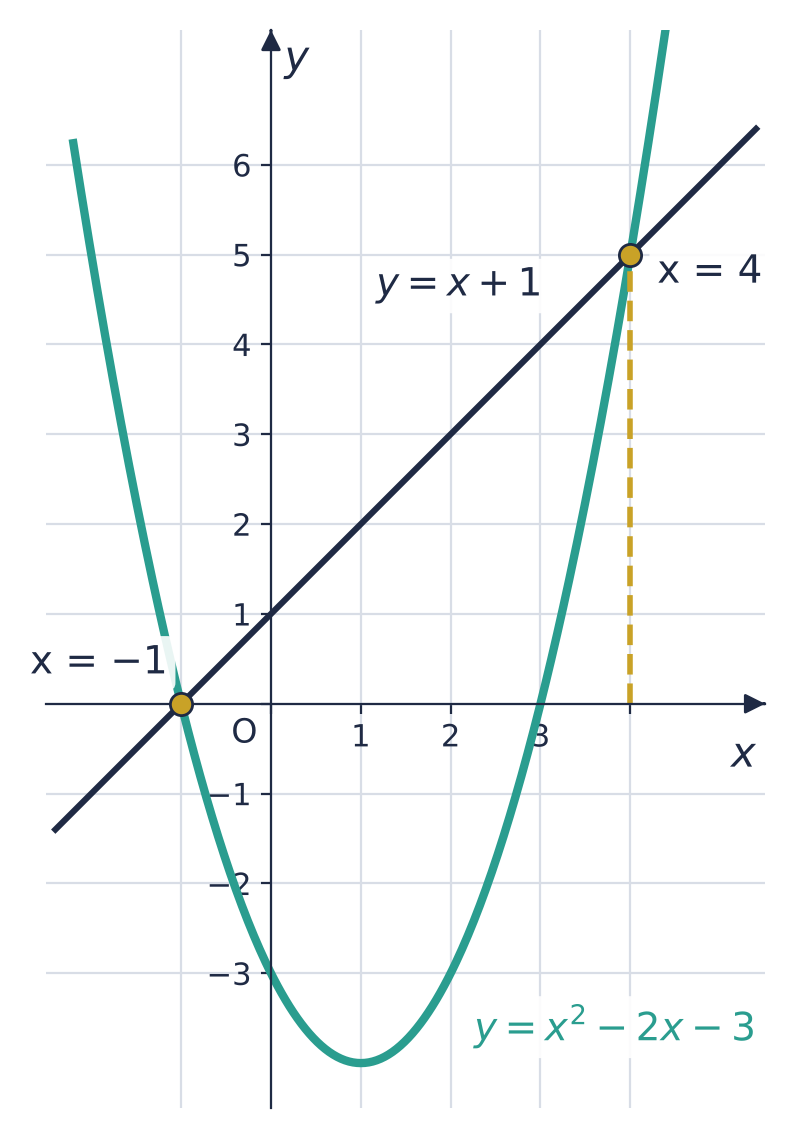
e.g.
Which line to draw: make the drawn curve one side
e.g.
- the curve is drawn, so draw
📖 Worked example
The diagram shows the graph of and the line . Use the graph to solve the equation .
Step 1 of 3
Each side of the equation is a graph
Left-hand side: , the curveRight-hand side: , the horizontal line
📖 Worked example
The graph of has been drawn. Find the equation of the straight line that must be drawn on the same axes to solve the equation .
Step 1 of 3
Rearrange so the drawn curve is the left-hand side
A range of x: where the curve is below (or above) the line
e.g.
- the curve is below the line between the crossings:
| The line (cubic with two turning points) | Solutions of |
|---|---|
| above the maximum point, or below the minimum point | |
| through a turning point | |
| between the two turning points |
📖 Worked example
The diagram shows the graph of , and the straight line that must be drawn on the same axes to solve the equation . Use the graph to solve this equation.
Step 1 of 3
Rearrange so the drawn curve is the left-hand side
📖 Worked example
The diagram shows the graph of . Find the range of values of for which the equation has three solutions.
Step 1 of 2
Read the y-coordinates of the turning points
Maximum point: Minimum point:
4. Speed–time graphs
| Feature | Meaning | Example |
|---|---|---|
| gradient | acceleration (m/s²) | m/s² |
| gradient going down | deceleration, given as a positive number | m/s² |
| horizontal | constant speed | m/s from s to s |
| area under the graph | distance travelled (m) | m |
| average speed | m/s | |
| km/h to m/s | km/h m/s |
📖 Worked example
The diagram shows the speed–time graph of a lorry over 65 seconds. Find the distance, in metres, travelled by the lorry in the first 45 seconds.
Step 1 of 3
Area A
📖 Worked example
The diagram shows the speed–time graph of a car that starts from rest and comes to rest again. The total distance travelled is 600 m. Find the value of .
Step 1 of 3
Write its area in terms of T, equal to the distance
Two vehicles: catching up means equal distances (equal areas)
e.g.
- equal speeds is only where the two graphs cross
📖 Worked example
A car starts from rest and accelerates uniformly to a speed of m/s in 8 s, then travels at that speed. As it starts, a lorry travelling at a constant speed of 12 m/s passes it, in the same direction. The diagram shows their speed–time graphs. The car catches up with the lorry after seconds. Find the value of .
Step 1 of 4
Distance of the car after T s: the area under its graph (a triangle, then a rectangle)
Try a question: Graphs of functions
Free · no sign-upAnswer a real practice question. Get it wrong and MugCorner shows you where it went wrong, with hints and a step-by-step guide.
Practise graphs of functions with step-by-step help
Endless questions from basic to exam level. Get one wrong and see where it went wrong. Free account.