Loading…
Sec 2 · G3 (Express)
Statistics
Practise statistics with step-by-step help. Free account.
1. Dot diagrams, stem-and-leaf diagrams and histograms
| Stem | Leaf |
|---|---|
| Key: means |
📖 Worked example
The dot diagram shows the number of hours some pupils slept last night. Find the median.
Step 1 of 2
Count the dots: each dot is one value
Number of values
| 2A leaves | Stem | 2B leaves |
|---|---|---|
| Key: means for 2A and for 2B |
📖 Worked example
The back-to-back stem-and-leaf diagram shows the heights, in cm, of seedlings grown with fertiliser X and with fertiliser Y. By comparing the ranges, state which group's results are more consistent.
Step 1 of 2
Find each group's range: largest − smallest
Range of X Range of Y
📖 Worked example
The stem-and-leaf diagram shows the ages of the people at a community centre class. One leaf is shown as . The median is years. Find the value of .
Step 1 of 2
Count the leaves (x is one of them): where is the median?
There are values.The median is the mean of the th and th values: and .
2. Mean, median and mode
| Average | Meaning | Books read: |
|---|---|---|
| mean | , so | |
| median | the middle value, in order | the 5th and 6th are both : |
| mode | the most common value |
Mean from a frequency table: Σfx ÷ Σf
e.g.
📖 Worked example
The numbers of books read by 6 pupils last month are . The mean is . Find .
Step 1 of 3
Total of all the values = mean × number of values
Total
📖 Worked example
The frequency table shows the number of co-curricular activities each pupil takes part in. Find the mean.
| Number of CCAs | 1 | 2 | 3 | 4 | 5 | 6 |
|---|---|---|---|---|---|---|
| Frequency | 4 | 9 | 4 | 3 | 3 | 5 |
Step 1 of 3
Total frequency: add the frequencies
Total frequency
| Every value | Mean, median, mode | Range |
|---|---|---|
| unchanged | ||
| unchanged | ||
| Which average? | When |
|---|---|
| median | one value is far from the rest (it pulls the mean towards it) |
| mode | the most common item or size is wanted, or the data are not numbers |
| mean | every value should count and none is extreme |
📖 Worked example
The mean, median, mode and range of the marks scored by 12 pupils in a 10-mark quiz are marks, marks, marks and marks. Every mark is then multiplied by to give a mark out of . Find the new range.
Step 1 of 2
Multiplying every value by 2 multiplies every average AND the range by 2
Every value is multiplied by , so the range is multiplied by .
📖 Worked example
The list shows the monthly salaries, in dollars, of the 9 people working in a small company: . Which average, the mean, the median or the mode, is the most suitable to use to describe a typical value?
Step 1 of 3
Work out the mean and the median
Mean (3 s.f.)Median
📖 Worked example
Five whole numbers have a mode of , a median of , a mean of and a range of . Find the five numbers, from the smallest to the largest.
Step 1 of 4
The median is the middle (3rd) number
The 3rd number is the median, .
📖 Worked example
The frequency table shows the number of co-curricular activities each pupil takes part in. The median is . Find the largest possible value of .
| Number of CCAs | 1 | 2 | 3 | 4 | 5 | 6 |
|---|---|---|---|---|---|---|
| Frequency | 6 | 2 | 2 | 2 | 5 | k |
Step 1 of 2
k values lie above 3: count the values on each side
Values above : Values equal to :
3. Grouped data
| Time (min) | Mid-value | Frequency | |
|---|---|---|---|
| Total |
Estimated mean: use the mid-values
e.g.
📖 Worked example
The table shows the distances some members of a cycling club rode on Sunday. Using the mid-value of each class, calculate an estimate of the mean, correct to 3 significant figures.
| Distance (d km) | Frequency |
|---|---|
| 12 | |
| 9 | |
| 6 | |
| 4 |
Step 1 of 4
Mid-value of each class: halfway between its ends
Mid-values:
📖 Worked example
The table shows the masses of some parcels at a post office. Find the class that contains the median.
| Mass (m kg) | Frequency |
|---|---|
| 9 | |
| 7 | |
| 8 | |
| 4 | |
| 2 | |
| 11 |
Step 1 of 3
Total frequency: where is the middle?
Total frequency The median is the th value.
4. Histograms
| To find | On the histogram |
|---|---|
| the frequency of a class | the height of its bar |
| the total frequency | add the heights of all the bars |
| the modal class | the class of the tallest bar |
| how many have | add the bars to the right of |
📖 Worked example
The histogram shows the distances, km, that the members of a cycling club rode last Sunday. Find the number of members with .
Step 1 of 2
Values more than 30: the classes from the boundary 30 upwards
: the classes to (a value of exactly is in the class below).
📖 Worked example
The histogram shows the distances, km, that the members of a cycling club rode last Sunday. Using the mid-value of each class, calculate an estimate of the mean, correct to 3 significant figures.
Step 1 of 5
Read the height of each bar on the frequency axis
Frequencies:
5. Choosing a statistical diagram
| Diagram | Best for | Limitation |
|---|---|---|
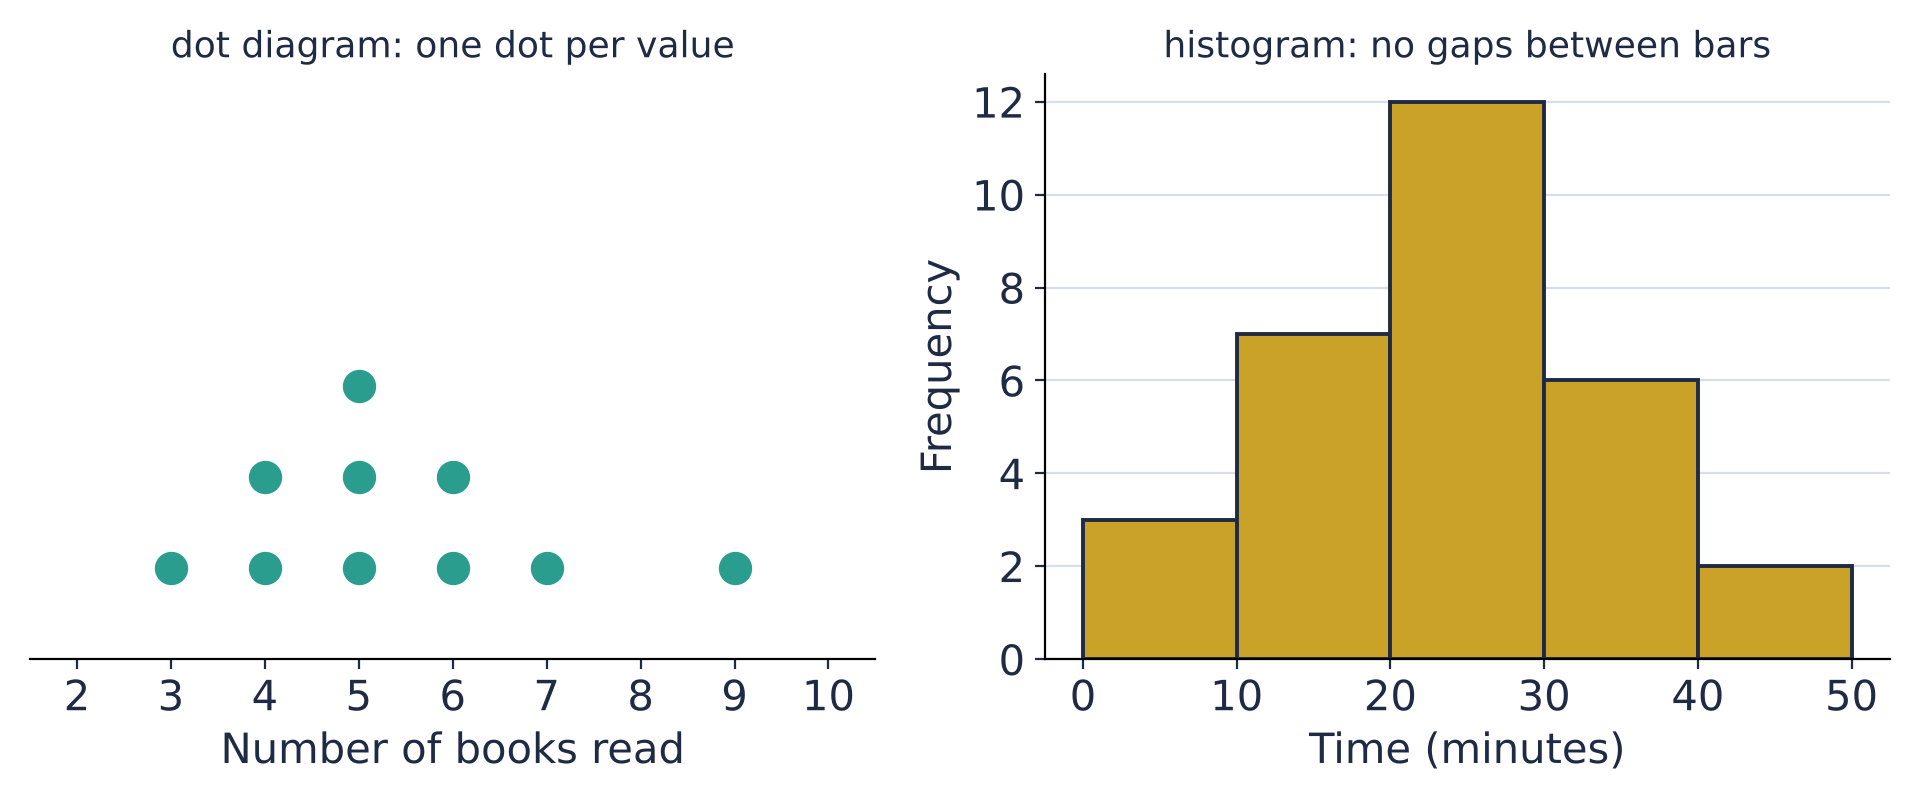
| Dot diagram | a small set of data with a few different values | too crowded for a large set of data |
| Stem-and-leaf diagram | keeping every value while showing the shape; the median is easy to find | needs a key; awkward for a very large set |
| Diagram | Best for | Limitation |
|---|---|---|
| Histogram | a large set of continuous data grouped in equal classes (bars touch) | the original values are lost |
📖 Worked example
The marks out of 100 of 25 pupils in a test (from 31 to 98) are to be shown so that every mark is kept and the median is easy to find. Which statistical diagram is the most suitable?
Step 1 of 2
What must the diagram do?
The diagram has to keep every value while showing the shape of the data.
Try a question: Statistics
Free · no sign-upAnswer a real practice question. Get it wrong and MugCorner shows you where it went wrong, with hints and a step-by-step guide.
Practise statistics with step-by-step help
Endless questions from basic to exam level. Get one wrong and see where it went wrong. Free account.