Loading…
IP Year 3
Cumulative frequency and spread
Practise cumulative frequency and spread with step-by-step help. Free account.
1. Cumulative frequency
- Frequency
- Cumulative frequency
- Frequency
- Cumulative frequency
- Frequency
- Cumulative frequency
- Frequency
- Cumulative frequency
- Frequency
- Cumulative frequency
- Frequency
- Cumulative frequency
| Marks | Frequency | Cumulative frequency |
|---|---|---|
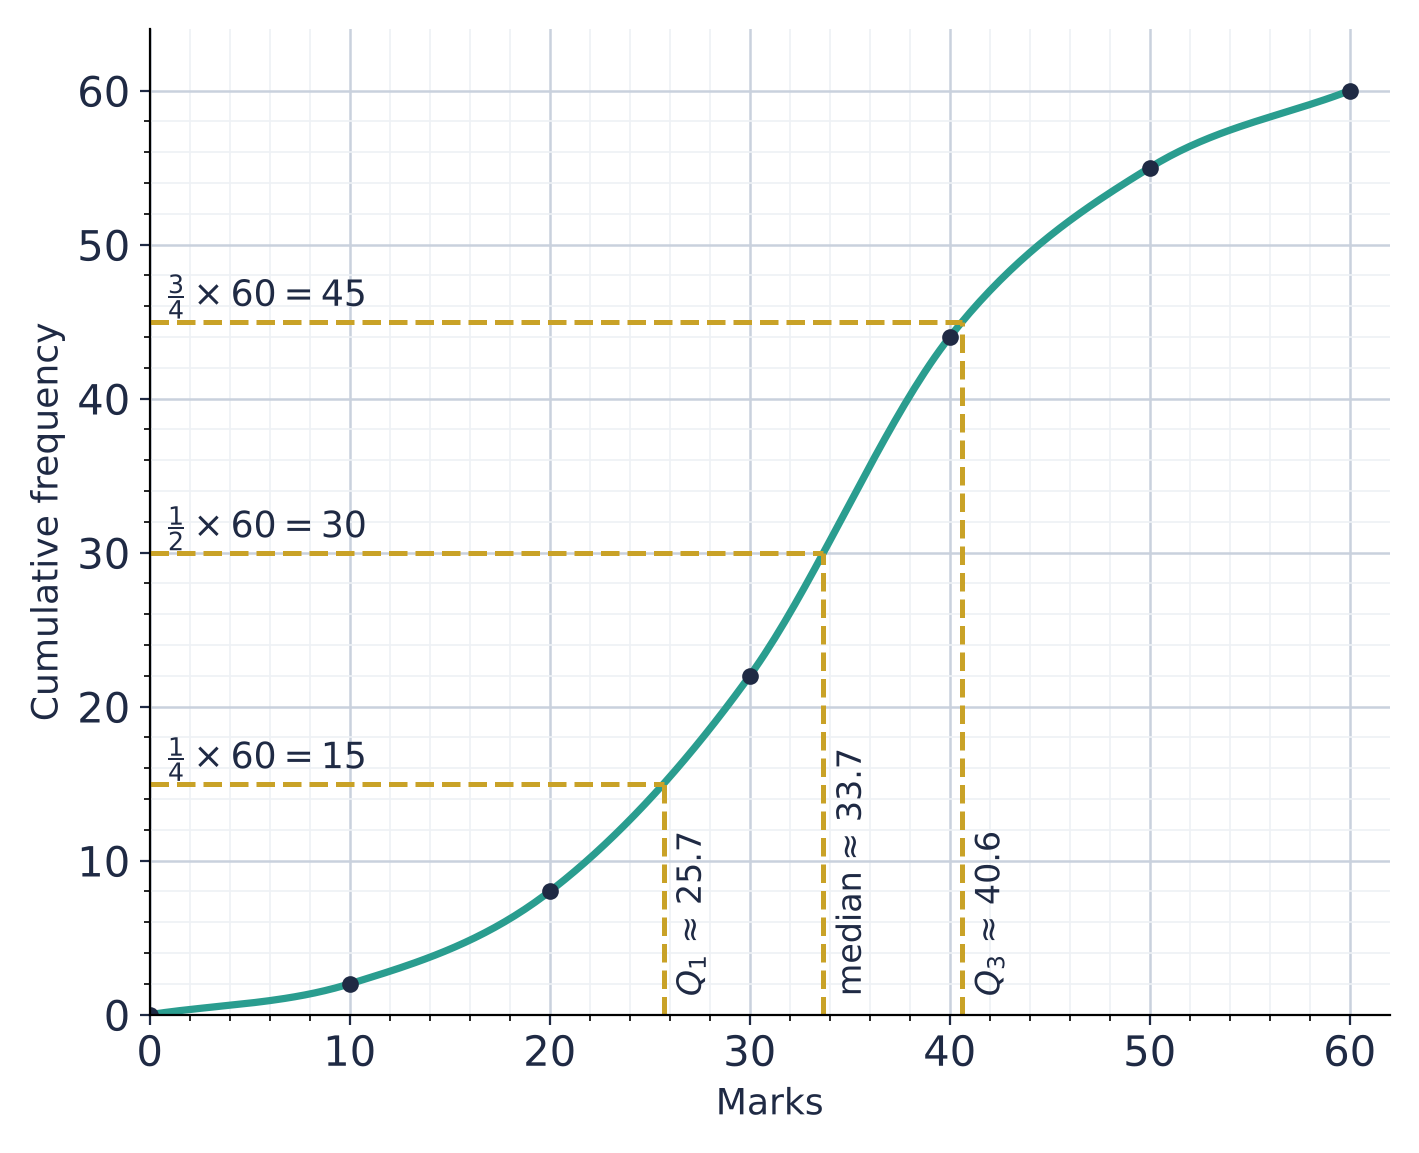
🎛️ Explore: read the curve
Up from , then across: about students scored at most marks
Interquartile range
- A count from a mark: up to the curve, then across to the cumulative frequency.
- A mark from a count (a quartile, a percentile): across to the curve, then down.
- The box plot underneath is the same three readings, with the lowest and highest possible marks at the ends.
📖 Worked example
The cumulative frequency curve shows the marks of students in a test. Use the curve to estimate the number of students who scored more than marks.
Step 1 of 3
Go up from the mark on the horizontal axis to the curve, then across
The curve gives about students with at most marks.
Your turn
Try one like these, checked as you answer, with hints if you need them. Free, no sign-up.
2. Median, quartiles and percentiles
lower quartile
- Read across from
- , so
- Here
median
- Read across from
- , so
- Here
upper quartile
- Read across from
- , so
- Here
interquartile range
- Read across from
- Here
th percentile
- Read across from
- Here
- 80th: across from
| From a curve ( values) | Read across from | Here |
|---|---|---|
| lower quartile | , so | |
| median | , so | |
| upper quartile | , so | |
| interquartile range | ||
| th percentile | 80th: across from |
From a list: 39, 42, 44, 46, 48, 50, 52, 55, 57, 61
- median: between the 5th and 6th, , so
- lower half :
- upper half :
📖 Worked example
The cumulative frequency curve shows the marks of students. Use the curve to estimate the median mark.
Step 1 of 2
Which cumulative frequency do you go across from?
percentage scoring or fewer
- On the curve
- up from , across: reading
with
- On the curve
- across from , then down
| Asked | On the curve |
|---|---|
| percentage scoring or fewer | up from , across: reading |
| with | across from , then down |
📖 Worked example
The cumulative frequency curve shows the marks of students. The probability that a student chosen at random scored more than marks is . Use the curve to estimate .
Step 1 of 4
Turn the probability into a number of students
More than marks: students
Your turn
Try one like these, checked as you answer, with hints if you need them. Free, no sign-up.
3. Box-and-whisker plots
range
- Formula
- max min
- Here
- , so
interquartile range
- Formula
- Here
- , so
| Measure | Formula | Here |
|---|---|---|
| range | max min | , so |
| interquartile range | , so |
📖 Worked example
The box-and-whisker plots show the times, in minutes, taken by two groups, and . Find the difference between their medians.
Step 1 of 2
Read each plot
: , , , ,
: , , , ,
📖 Worked example
The table gives some information about the times, in minutes, taken by a group of students to travel to school. On the scale, draw a box-and-whisker plot to show the information.
Step 1 of 1
Draw it above the scale
smallest value , lower quartile , median , upper quartile , largest value .
More worked examples (1)
📖 Worked example
The box-and-whisker plot shows the times, in minutes, that some students took to finish a task. of the students took less than minutes. Find the number of students who did the task.
Step 1 of 3
Read the plot: which of the five values is 20?
is the lower quartile, .
Your turn
Try one like these, checked as you answer, with hints if you need them. Free, no sign-up.
4. Mean and standard deviation
mean
- List
- Frequency table
standard deviation
- List
- Frequency table
or
- List
- Frequency table
| List | Frequency table | |
|---|---|---|
| mean | ||
| standard deviation | ||
| or |
30, 34, 35, 39, 42: Σx = 180, Σx² = 6566
e.g.
The same data, the other way: mean 36
e.g.
📖 Worked example
The table shows the marks of students. Using the mid-values of the classes, estimate the mean mark, correct to 3 significant figures.
| Marks, | Frequency |
|---|---|
| 2 | |
| 6 | |
| 14 | |
| 22 | |
| 11 | |
| 5 |
Step 1 of 2
Use the mid-values x with the frequencies f
or
- Mean
- or
- Standard deviation
- unchanged
- Mean
- Standard deviation
| Every value | Mean | Standard deviation |
|---|---|---|
| or | or | unchanged |
📖 Worked example
The mean and the standard deviation of the marks of a class in a test are marks and marks. Every student is then given extra marks for a question that was marked wrongly. Write down the new standard deviation.
Step 1 of 2
Every value changes as the question says: what happens to the standard deviation?
The standard deviation stays the same: moving every value by the same amount moves the mean, but the spread about it does not change.
Your turn
Try one like these, checked as you answer, with hints if you need them. Free, no sign-up.
5. Comparing two data sets
mean or median
- Meaning
- larger: the values are higher on average (say what that means, e.g. better marks, or took longer)
standard deviation or IQR
- Meaning
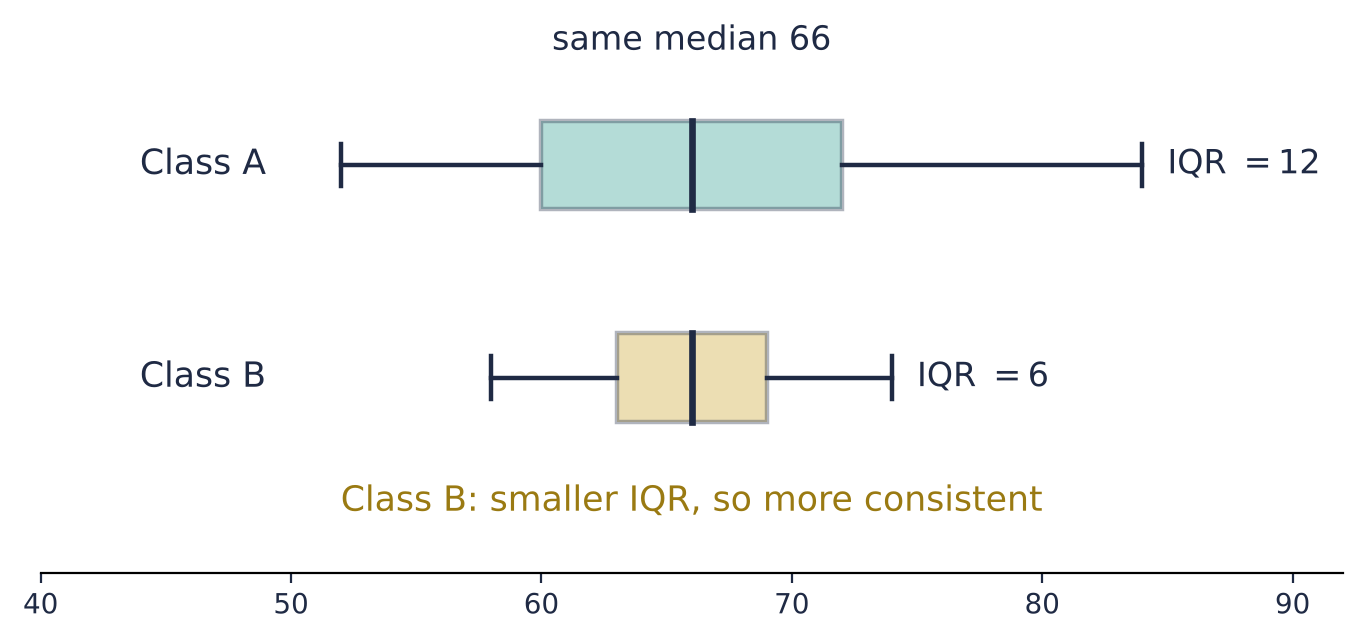
- smaller: more consistent (less spread out)
| Compare | Meaning |
|---|---|
| mean or median | larger: the values are higher on average (say what that means, e.g. better marks, or took longer) |
| standard deviation or IQR | smaller: more consistent (less spread out) |
📖 Worked example
The numbers of books read by some students in two classes are shown. Class : . Class : . Which class's numbers of books read were more consistent?
Step 1 of 4
Which measure answers the question?
More consistent means less spread: the smaller standard deviation.
Your turn
Try one like these, checked as you answer, with hints if you need them. Free, no sign-up.
Free account
What you get when you sign in
Everything on this page stays free. An account is where cumulative frequency and spread practice starts adding up.
- Endless questions on every chapter, at every level
- Your mistakes tracked by type, so you see what keeps costing marks
- Revision reminders before a topic fades
Start freeFree account. No card. Takes a minute.
Compare browsing and a free account
| Browsing | Account | |
|---|---|---|
| Read the notes and print worksheets and papers | ✓ | ✓ |
| Try a question with marking, hints and the step guide | ✓ | ✓ |
| Endless questions on every chapter, at every level | – | ✓ |
| Levels that unlock as you improve | – | ✓ |
| Your mistakes tracked by type, so you see what keeps costing marks | – | ✓ |
| WA practice papers on the chapters being tested | – | ✓ |
| Revision reminders before a topic fades | – | ✓ |
| Progress page and leaderboards | – | ✓ |