Loading…
IGCSE Additional Mathematics (0606)
Kinematics
Practise kinematics with step-by-step help. Free account.
1. Displacement, velocity and acceleration
velocity
- Differentiate
- Integrate
acceleration
- Differentiate
displacement
- Integrate
| Find | Differentiate | Integrate |
|---|---|---|
| velocity | ||
| acceleration | ||
| displacement |
at
- Means
instantaneously at rest
- Means
initial
- Means
maximum or minimum velocity
- Means
| Words | Means |
|---|---|
| at | |
| instantaneously at rest | |
| initial | |
| maximum or minimum velocity |
At rest: s = t³ − 12t² + 45t
e.g.
🎛️ Explore: drag the sliders or type the numbers
xyDrag the graph to move around.
- s
- v (green)
- a (grey)
- Green is , grey is , and the other curve is . The dots are their values at the time chosen.
- at and : the particle is at rest and turns round. That is where has its turning points.
- At it is moving forwards (), slowing down ( and have opposite signs).
- Distance travelled from to is not : add the parts , , , as it turns round at and ( m).
Plot your own graph
Type with x, e.g. 2sin(3x) + 1, (x - 1)(x + 3), 1/x, 2^x, ln(x), sqrt(x). The axes fit what you draw.
📖 Worked example
A particle moves in a straight line so that, seconds after passing through a fixed point , its displacement from , m, is given by . Find the values of at which the particle is instantaneously at rest.
Step 1 of 4
Find v from s: differentiate or integrate?
Your turn
Try one like these, checked as you answer, with hints if you need them. Free, no sign-up.
2. Integrating to find velocity and displacement
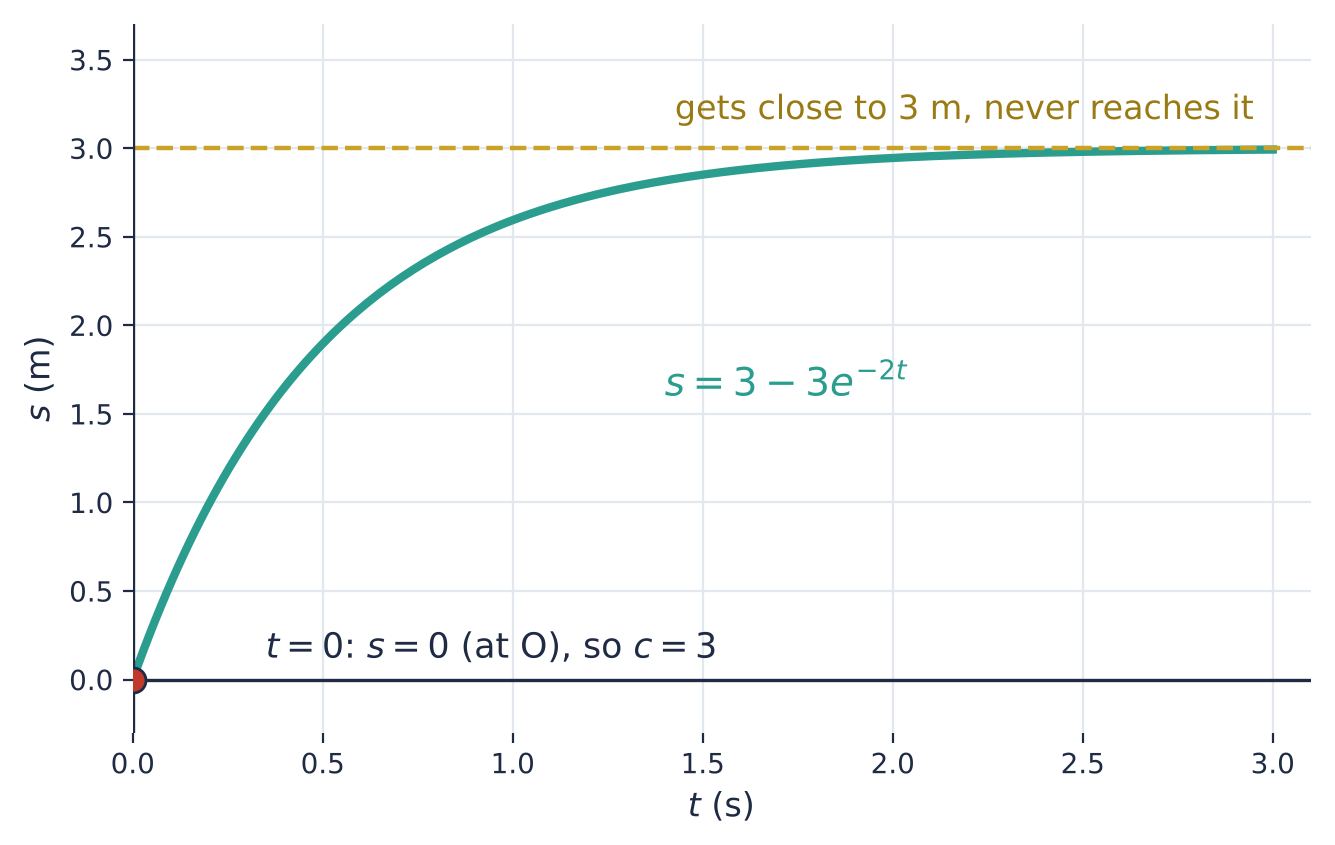
v = 6e⁻²ᵗ, starting at O
e.g.
📖 Worked example
A particle moves in a straight line so that, seconds after passing through a fixed point , its velocity, m/s, is given by . Find its exact displacement from when .
Step 1 of 3
Displacement: s = ∫ v dt (e to the power kt integrates to itself divided by k)
Your turn
Try one like these, checked as you answer, with hints if you need them. Free, no sign-up.
3. Distance travelled
v = t² − 7t + 6 in the first 5 seconds: it turns back at t = 1
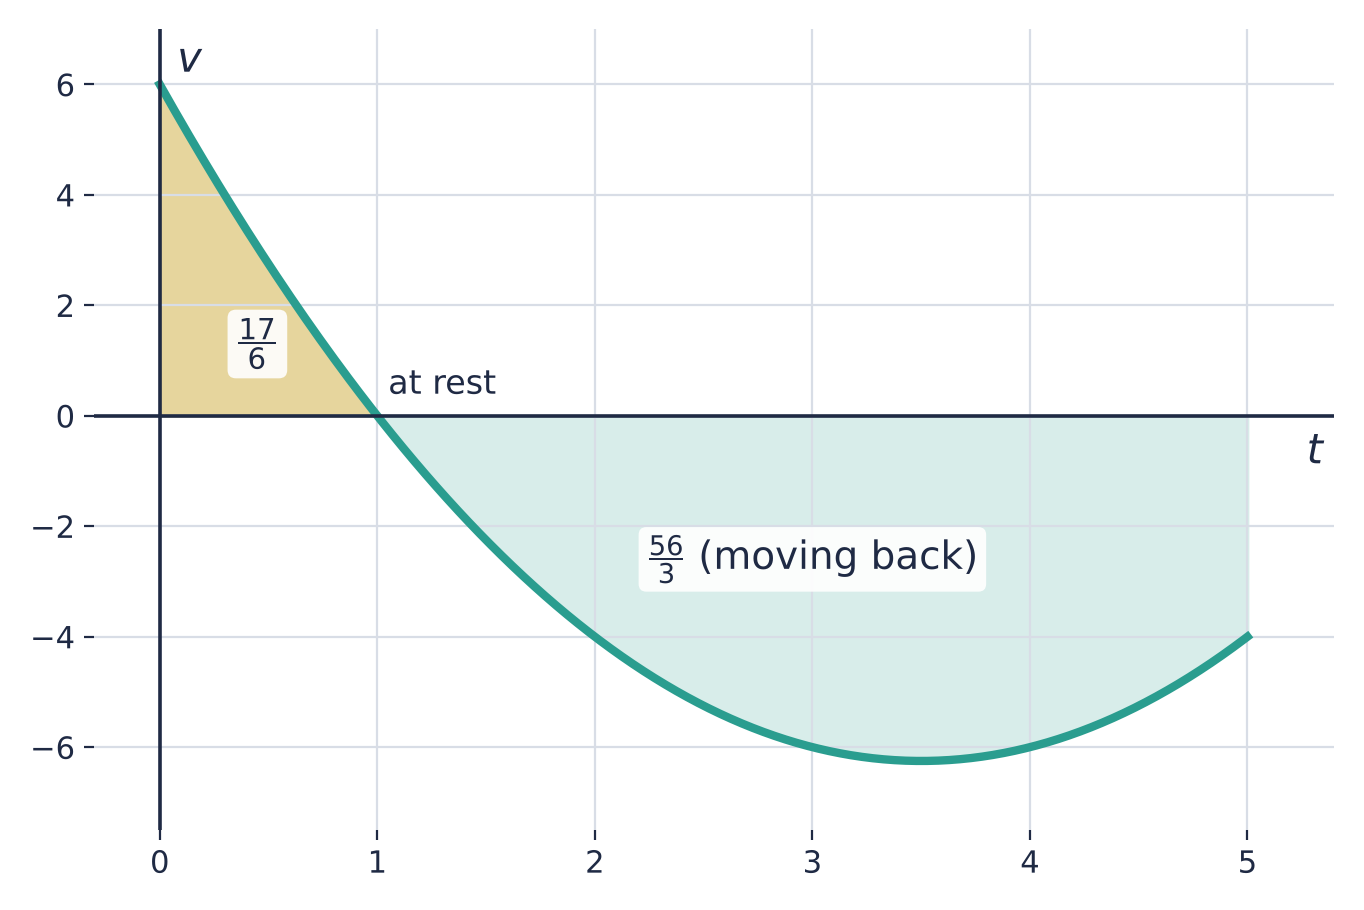
- to : m
- to : m (moving back)
- distance: , which is m
📖 Worked example
A particle moves in a straight line so that, seconds after passing through a fixed point , its velocity, m/s, is given by . Find the total distance travelled by the particle in the first seconds.
Step 1 of 4
Does it turn back? Find when v = 0
or
Your turn
Try one like these, checked as you answer, with hints if you need them. Free, no sign-up.
4. Displacement, velocity and acceleration graphs
📖 Worked example
In this question, time is in seconds and displacement is in metres. The diagram shows the velocity–time graph for a particle moving in a straight line. On the axes, draw the acceleration–time graph for the motion of the particle.
Step 1 of 2
The acceleration is the gradient of each straight stage: the change in velocity ÷ the time it takes
From to :
From to :
From to :
📖 Worked example
In this question, time is in seconds and displacement is in metres. The diagram shows the velocity–time graph for a particle moving in a straight line, for . Find the total distance travelled by the particle.
Step 1 of 2
The area between the graph and the time axis is the distance moved: find the area above the axis and the area below it
Above the axis
Below the axis
Your turn
Try one like these, checked as you answer, with hints if you need them. Free, no sign-up.
Free account
What you get when you sign in
Everything on this page stays free. An account is where kinematics practice starts adding up.
- Endless questions on every chapter, at every level
- Your mistakes tracked by type, so you see what keeps costing marks
- Revision reminders before a topic fades
Start freeFree account. No card. Takes a minute.
Compare browsing and a free account
| Browsing | Account | |
|---|---|---|
| Read the notes and print worksheets and papers | ✓ | ✓ |
| Try a question with marking, hints and the step guide | ✓ | ✓ |
| Endless questions on every chapter, at every level | – | ✓ |
| Levels that unlock as you improve | – | ✓ |
| Your mistakes tracked by type, so you see what keeps costing marks | – | ✓ |
| WA practice papers on the chapters being tested | – | ✓ |
| Revision reminders before a topic fades | – | ✓ |
| Progress page and leaderboards | – | ✓ |