Loading…
IGCSE Mathematics (0580) · Extended
Statistics
Practise statistics with step-by-step help. Free account.
1. Mean, median and mode
mean
- Meaning
- Books read:
- , so
median
- Meaning
- the middle value, in order
- Books read:
- the 5th and 6th are both :
mode
- Meaning
- the most common value
- Books read:
| Average | Meaning | Books read: |
|---|---|---|
| mean | , so | |
| median | the middle value, in order | the 5th and 6th are both : |
| mode | the most common value |
Mean from a frequency table: Σfx ÷ Σf
e.g.
🎛️ Explore: drag the last value out and watch the averages
- In order
- Mean
- Median
- Mode
- Every value counts in the mean, so one far-out value pulls it a long way.
- The median only needs the middle of the order: moving the biggest value further out doesn't change it.
- So with an outlier (one value far from the rest), the median describes the data better.
📖 Worked example
The numbers of books read by 6 pupils last month are . The mean is . Find .
Step 1 of 3
Total of all the values = mean × number of values
Total
📖 Worked example
The frequency table shows the number of co-curricular activities each pupil takes part in. Find the mean.
| Number of club | 1 | 2 | 3 | 4 | 5 | 6 |
|---|---|---|---|---|---|---|
| Frequency | 4 | 9 | 4 | 3 | 3 | 5 |
Step 1 of 3
Total frequency: add the frequencies
Total frequency
- Mean, median, mode
- Range
- unchanged
- Mean, median, mode
- Range
- unchanged
- Mean, median, mode
- Range
| Every value | Mean, median, mode | Range |
|---|---|---|
| unchanged | ||
| unchanged | ||
median
- When
- one value is far from the rest (it pulls the mean towards it)
mode
- When
- the most common item or size is wanted, or the data are not numbers
mean
- When
- every value should count and none is extreme
| Which average? | When |
|---|---|
| median | one value is far from the rest (it pulls the mean towards it) |
| mode | the most common item or size is wanted, or the data are not numbers |
| mean | every value should count and none is extreme |
More worked examples (4)
📖 Worked example
The mean, median, mode and range of the marks scored by 12 pupils in a 10-mark quiz are marks, marks, marks and marks. Every mark is then multiplied by to give a mark out of . Find the new range.
Step 1 of 2
Every value changes as the question says: what happens to the range?
Multiplying every value by 2 multiplies every average AND the range by 2.
Every value is multiplied by , so the range is multiplied by .
📖 Worked example
The list shows the monthly salaries, in dollars, of the 9 people working in a small company: . Which average, the mean, the median or the mode, is the most suitable to use to describe a typical value?
Step 1 of 3
Work out the mean and the median
Mean
3 s.f.
Median
📖 Worked example
Five whole numbers have a mode of , a median of , a mean of and a range of . Find the five numbers, from the smallest to the largest.
Step 1 of 4
Use the median: which number is it?
The 3rd number is the median, .
📖 Worked example
The frequency table shows the number of co-curricular activities each pupil takes part in. The median is . Find the largest possible value of .
| Number of club | 1 | 2 | 3 | 4 | 5 | 6 |
|---|---|---|---|---|---|---|
| Frequency | 6 | 2 | 2 | 2 | 5 | k |
Step 1 of 2
k values lie above 3: count the values on each side
Values above :
Values of or less:
Your turn
Try one like these, checked as you answer, with hints if you need them. Free, no sign-up.
2. Dot diagrams, stem-and-leaf diagrams and histograms
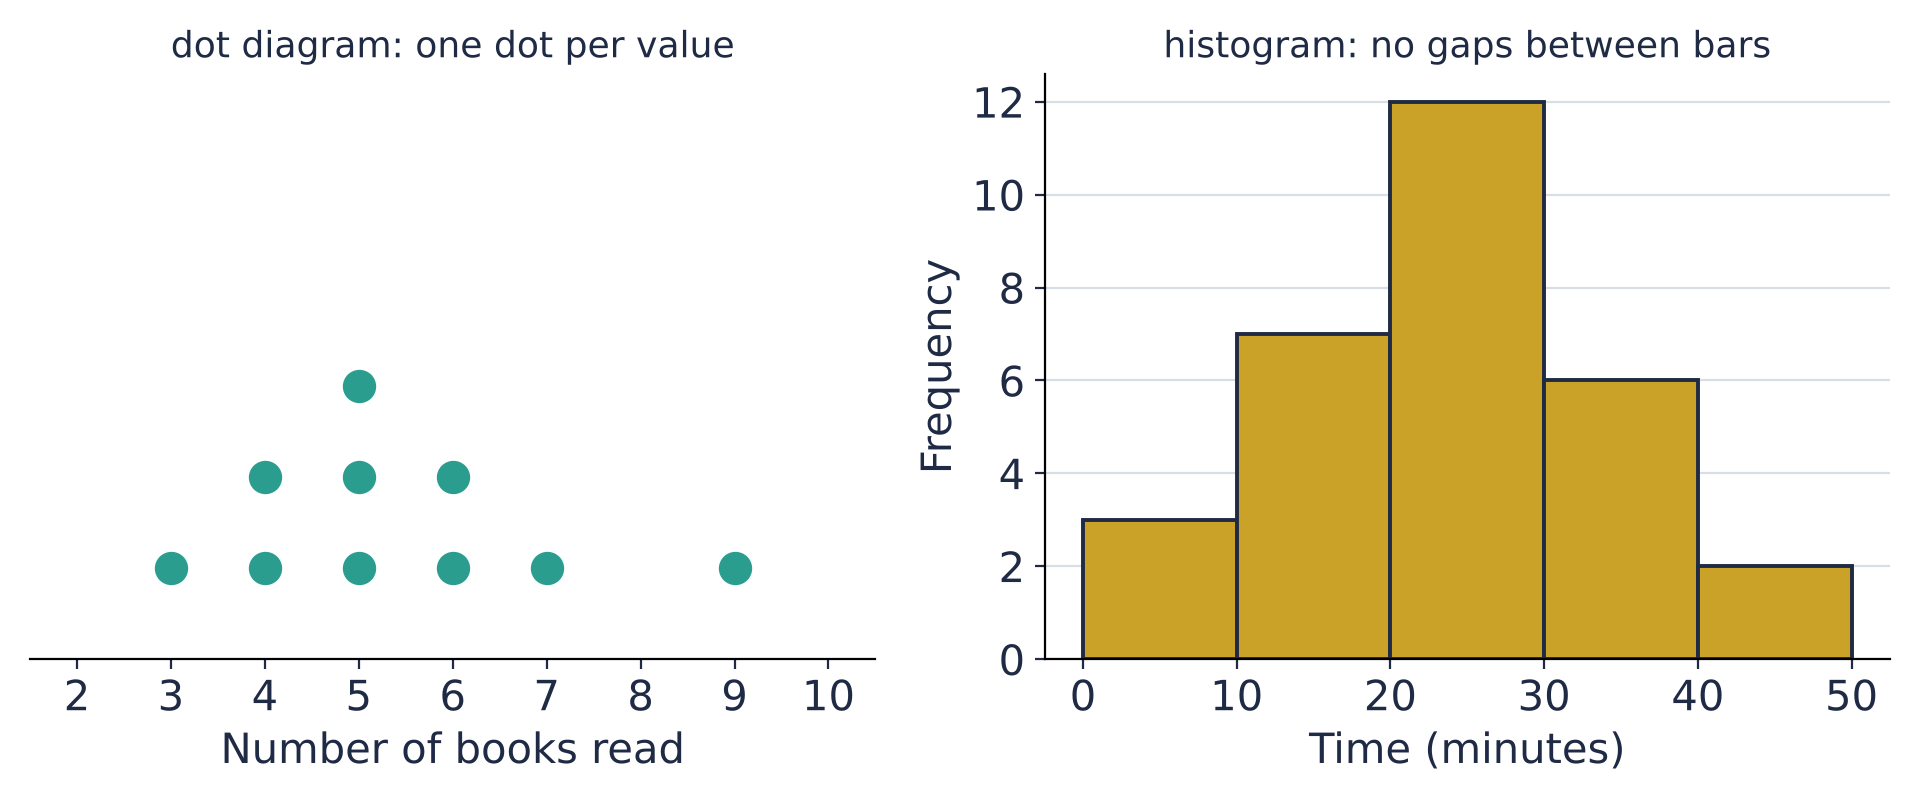
- Leaf
- Leaf
- Leaf
Key: means
| Stem | Leaf |
|---|---|
| Key: means |
- Stem
- 2B leaves
- Stem
- 2B leaves
- Stem
- 2B leaves
Key: means for 2A and for 2B
| 2A leaves | Stem | 2B leaves |
|---|---|---|
| Key: means for 2A and for 2B |
📖 Worked example
The back-to-back stem-and-leaf diagram shows the heights, in cm, of seedlings grown with fertiliser X and with fertiliser Y. By comparing the ranges, state which group's results are more consistent.
Step 1 of 2
Find each group's range: largest − smallest
Range of X
Range of Y
📖 Worked example
The stem-and-leaf diagram shows the ages of the people at a community centre class. One leaf is shown as . The median is years. Find the value of .
Step 1 of 2
Count the leaves (x is one of them): where is the median?
There are values.
The median is the mean of the th and th values: and .
Your turn
Try one like these, checked as you answer, with hints if you need them. Free, no sign-up.
3. Collecting data, pictograms and bar graphs
Bus
- Tally
- Frequency
train
- Tally
- Frequency
Car
- Tally
- Frequency
Walk
- Tally
- Frequency
Total
- Frequency
| Mode of transport | Tally | Frequency |
|---|---|---|
| Bus | ||
| train | ||
| Car | ||
| Walk | ||
| Total |
📖 Worked example
The bar graph shows the favourite street food of a class. Find how many more pupils there are for Satay than for Nasi lemak.
Step 1 of 2
Work out what one small division stands for, then read the two bars
One small division stands for .
Satay: ; Nasi lemak:
Your turn
Try one like these, checked as you answer, with hints if you need them. Free, no sign-up.
4. Pie charts and bar graphs
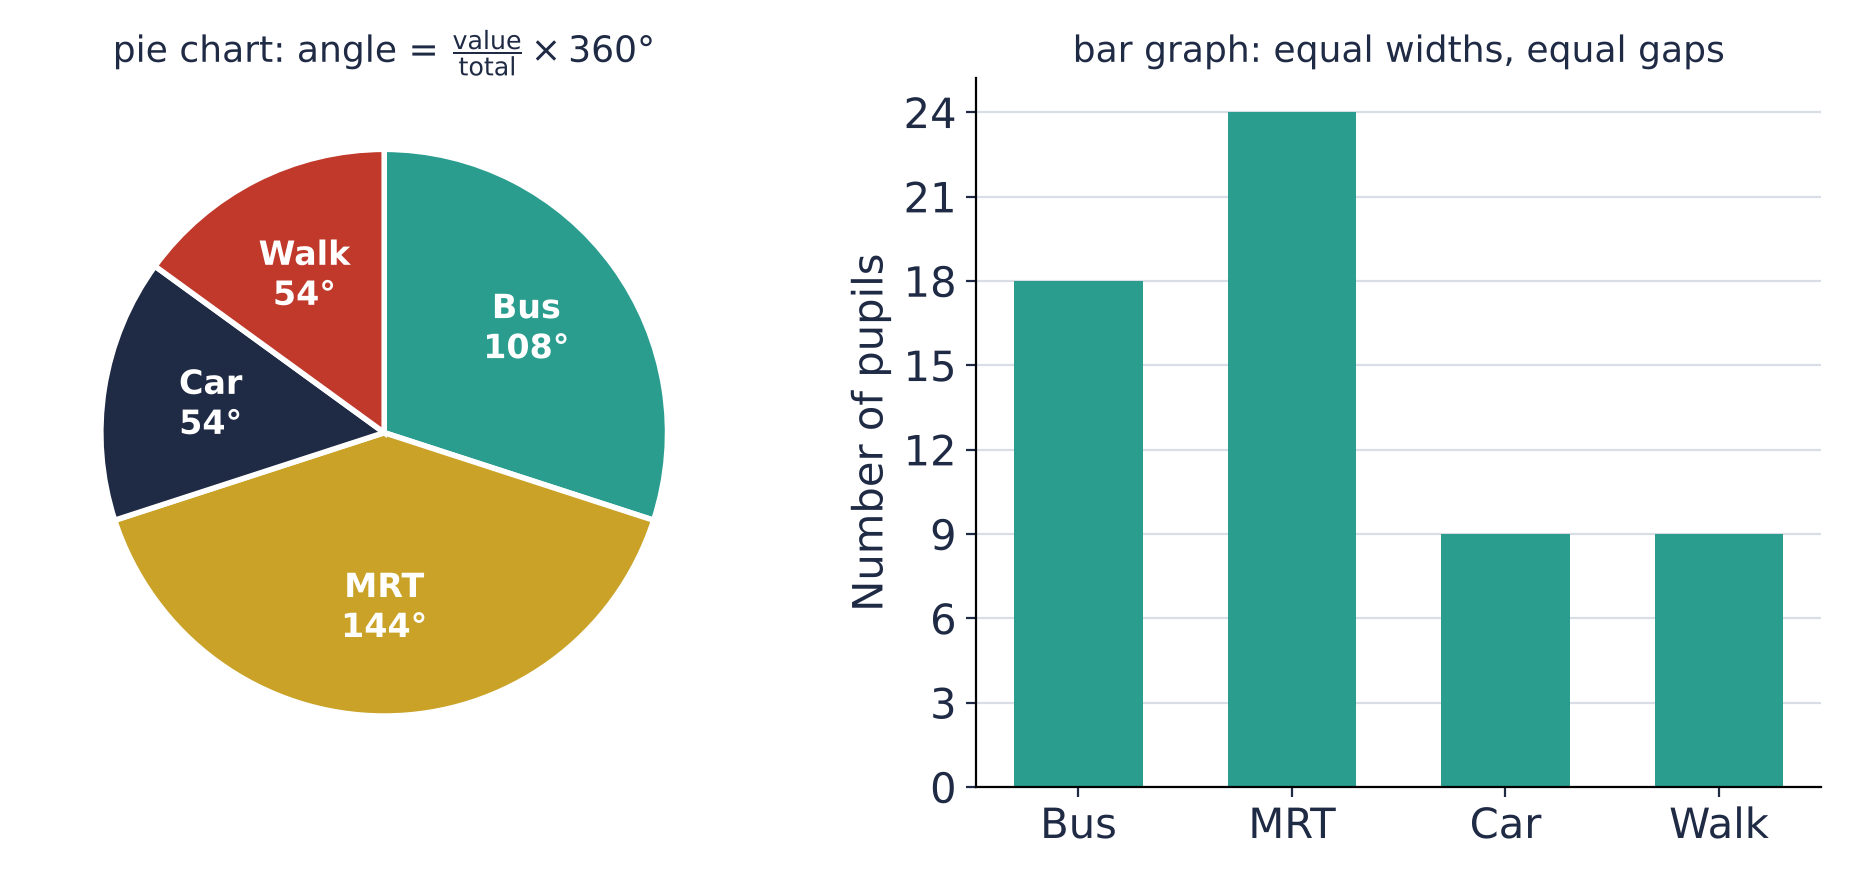
Angle for Bus: 18 out of 60
e.g.
From an angle back to a number: Car is 54°
e.g.
📖 Worked example
The table shows the club chosen by Secondary 1 pupils. The information is to be shown in a pie chart. Calculate the angle of the sector for Uniformed.
| Item | Uniformed | Sports | Arts | Clubs |
|---|---|---|---|---|
| Number of pupils | 42 | 27 | 32 | 19 |
Step 1 of 2
Find the total
Your turn
Try one like these, checked as you answer, with hints if you need them. Free, no sign-up.
5. Grouped data
- Mid-value
- Frequency
- Mid-value
- Frequency
- Mid-value
- Frequency
- Mid-value
- Frequency
- Mid-value
- Frequency
Total
- Frequency
| Time (min) | Mid-value | Frequency | |
|---|---|---|---|
| Total |
Estimated mean: use the mid-values
e.g.
📖 Worked example
The table shows the distances some members of a cycling club rode on Sunday. Using the mid-value of each class, calculate an estimate of the mean, correct to 3 significant figures.
| Distance (d km) | Frequency |
|---|---|
| 12 | |
| 9 | |
| 6 | |
| 4 |
Step 1 of 4
Mid-value of each class: halfway between its ends
Mid-values
📖 Worked example
The table shows the masses of some parcels at a post office. Find the class that contains the median.
| Mass (m kg) | Frequency |
|---|---|
| 9 | |
| 7 | |
| 8 | |
| 4 | |
| 2 | |
| 11 |
Step 1 of 3
Total frequency: where is the middle?
Total frequency
The median is the th value.
Your turn
Try one like these, checked as you answer, with hints if you need them. Free, no sign-up.
6. Cumulative frequency
- Frequency
- Cumulative frequency
- Frequency
- Cumulative frequency
- Frequency
- Cumulative frequency
- Frequency
- Cumulative frequency
- Frequency
- Cumulative frequency
- Frequency
- Cumulative frequency
| Marks | Frequency | Cumulative frequency |
|---|---|---|
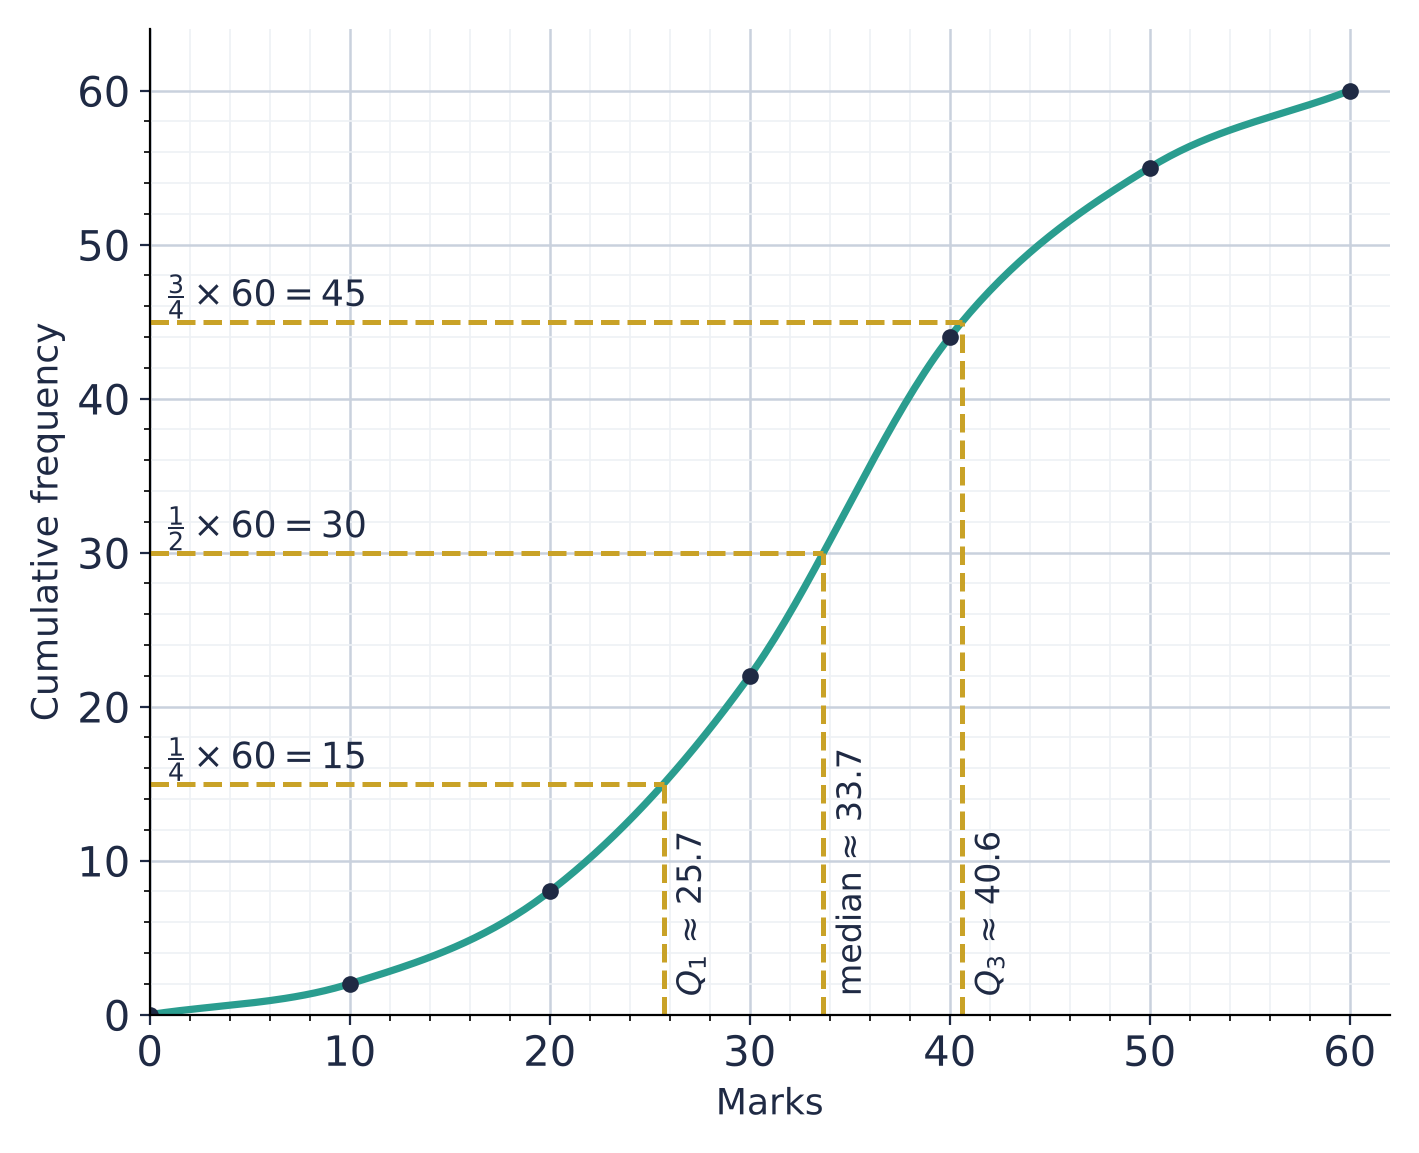
🎛️ Explore: read the curve
Up from , then across: about students scored at most marks
Interquartile range
- A count from a mark: up to the curve, then across to the cumulative frequency.
- A mark from a count (a quartile, a percentile): across to the curve, then down.
- The box plot underneath is the same three readings, with the lowest and highest possible marks at the ends.
📖 Worked example
The cumulative frequency curve shows the marks of students in a test. Use the curve to estimate the number of students who scored more than marks.
Step 1 of 3
Go up from the mark on the horizontal axis to the curve, then across
The curve gives about students with at most marks.
Your turn
Try one like these, checked as you answer, with hints if you need them. Free, no sign-up.
7. Median, quartiles and percentiles
lower quartile
- Read across from
- , so
- Here
median
- Read across from
- , so
- Here
upper quartile
- Read across from
- , so
- Here
interquartile range
- Read across from
- Here
th percentile
- Read across from
- Here
- 80th: across from
| From a curve ( values) | Read across from | Here |
|---|---|---|
| lower quartile | , so | |
| median | , so | |
| upper quartile | , so | |
| interquartile range | ||
| th percentile | 80th: across from |
From a list: 39, 42, 44, 46, 48, 50, 52, 55, 57, 61
- median: between the 5th and 6th, , so
- lower half :
- upper half :
📖 Worked example
The cumulative frequency curve shows the marks of students. Use the curve to estimate the median mark.
Step 1 of 2
Which cumulative frequency do you go across from?
percentage scoring or fewer
- On the curve
- up from , across: reading
with
- On the curve
- across from , then down
| Asked | On the curve |
|---|---|
| percentage scoring or fewer | up from , across: reading |
| with | across from , then down |
📖 Worked example
The cumulative frequency curve shows the marks of students. The probability that a student chosen at random scored more than marks is . Use the curve to estimate .
Step 1 of 4
Turn the probability into a number of students
More than marks: students
Your turn
Try one like these, checked as you answer, with hints if you need them. Free, no sign-up.
8. Histograms
the frequency of a class
- On the histogram
- the height of its bar
the total frequency
- On the histogram
- add the heights of all the bars
the modal class
- On the histogram
- the class of the tallest bar
how many have
- On the histogram
- add the bars to the right of
| To find | On the histogram |
|---|---|
| the frequency of a class | the height of its bar |
| the total frequency | add the heights of all the bars |
| the modal class | the class of the tallest bar |
| how many have | add the bars to the right of |
📖 Worked example
The histogram shows the distances, km, that the members of a cycling club rode last Sunday. Find the number of members with .
Step 1 of 2
Values more than 30: the classes from the boundary 30 upwards
: the classes to (a value of exactly is in the class below).
📖 Worked example
The histogram shows the distances, km, that the members of a cycling club rode last Sunday. Using the mid-value of each class, calculate an estimate of the mean, correct to 3 significant figures.
Step 1 of 5
Read the height of each bar on the frequency axis
Frequencies
Your turn
Try one like these, checked as you answer, with hints if you need them. Free, no sign-up.
9. Histograms with unequal class widths
Frequency density
e.g.
Frequency from a bar
e.g.
📖 Worked example
The table shows the times, minutes, that some people waited at a clinic. Complete the frequency density column of the table.
Step 1 of 2
Frequency density = frequency ÷ class width
The class width is the upper boundary minus the lower boundary.
📖 Worked example
The histogram shows the times, minutes, that some people waited at a clinic. How many people are in the class ?
Step 1 of 2
Read the height of the bar: its frequency density
More worked examples (1)
📖 Worked example
The histogram shows the times, minutes, that some people waited at a clinic. Estimate the number of people with .
Step 1 of 2
Frequency = density × width: for the part of a bar in the range, use only that part's width
Your turn
Try one like these, checked as you answer, with hints if you need them. Free, no sign-up.
10. Scatter diagrams
positive
- The points
- go up from left to right: as one increases, so does the other
negative
- The points
- go down from left to right: as one increases, the other decreases
none
- The points
- no pattern
| Correlation | The points |
|---|---|
| positive | go up from left to right: as one increases, so does the other |
| negative | go down from left to right: as one increases, the other decreases |
| none | no pattern |
📖 Worked example
The scatter diagram shows the test mark and the number of hours of revision for students. What type of correlation does it show?
Step 1 of 2
Look at the pattern of the points, from left to right
From left to right, the points go up
📖 Worked example
The scatter diagram shows the test mark and the number of hours of revision for students. A line of best fit has been drawn. Use it to estimate the test mark when the number of hours of revision is hours.
Step 1 of 1
Go up from 5 on the horizontal axis to the line, then across to the vertical axis
One small square up is 2
Reading: about 52
More worked examples (1)
📖 Worked example
The scatter diagram shows the test mark and the number of hours of revision for students. Which of the labelled points does not follow the trend of the others?
Step 1 of 2
Find the trend of most of the points
From left to right, the points go up
Your turn
Try one like these, checked as you answer, with hints if you need them. Free, no sign-up.
11. Frequency and two-way tables
Boys
- Walk
- Bus
- Total
Girls
- Walk
- Bus
- Total
Total
- Walk
- Bus
- Total
| Walk | Bus | Total | |
|---|---|---|---|
| Boys | |||
| Girls | |||
| Total |
📖 Worked example
The two-way table shows information about some members of a club. Complete the table.
Step 1 of 1
Find a row or column with only one gap: the total minus the others (or the others added)
Year 11, Chess
Total, Tennis
Year 10, Football
Year 10, Total
Your turn
Try one like these, checked as you answer, with hints if you need them. Free, no sign-up.
Free account
What you get when you sign in
Everything on this page stays free. An account is where statistics practice starts adding up.
- Endless questions on every chapter, at every level
- Your mistakes tracked by type, so you see what keeps costing marks
- Revision reminders before a topic fades
Start freeFree account. No card. Takes a minute.
Compare browsing and a free account
| Browsing | Account | |
|---|---|---|
| Read the notes and print worksheets and papers | ✓ | ✓ |
| Try a question with marking, hints and the step guide | ✓ | ✓ |
| Endless questions on every chapter, at every level | – | ✓ |
| Levels that unlock as you improve | – | ✓ |
| Your mistakes tracked by type, so you see what keeps costing marks | – | ✓ |
| WA practice papers on the chapters being tested | – | ✓ |
| Revision reminders before a topic fades | – | ✓ |
| Progress page and leaderboards | – | ✓ |