Loading…
IGCSE Mathematics (0580) · Extended
Graphs of functions
Practise graphs of functions with step-by-step help. Free account.
1. Table of values for a quadratic
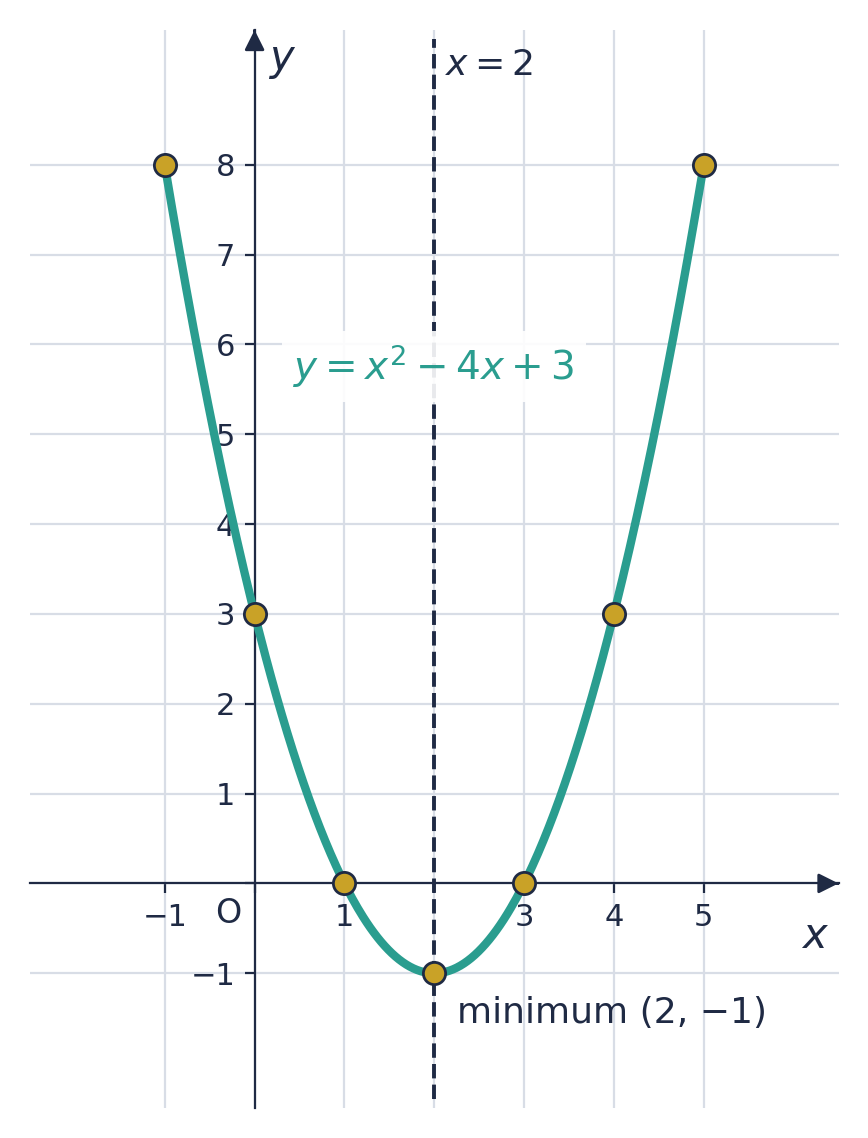
Put a negative x in brackets, x = −1
e.g.
📖 Worked example
Complete the table of values for .
Step 1 of 2
Put each missing x into the equation and work out each term. Square a NEGATIVE x first: (−2)² = 4, not −4
When :
When :
When :
When :
📖 Worked example
Complete the table of values for .
Step 1 of 2
Put each missing x into the equation and work out each term. Square a NEGATIVE x first: (−2)² = 4, not −4; and −x² means −(x²)
When :
When :
When :
When :
Your turn
Try one like these, checked as you answer, with hints if you need them. Free, no sign-up.
2. Reading a quadratic graph
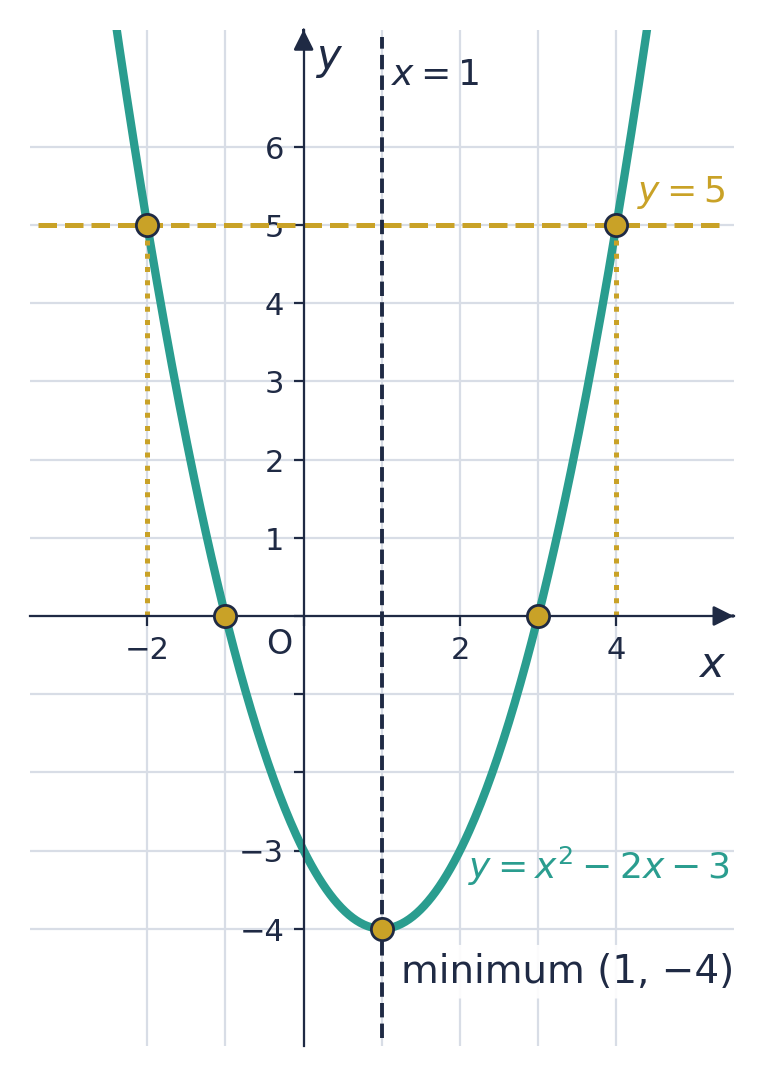
for a given
- How
- up (or down) from to the curve, then across to the -axis
- On
- :
for a given
- How
- along the line to the curve, then down to the -axis
- On
- or
where it crosses the -axis
- How
- the points where
- On
- or
minimum point
- How
- the lowest point
- On
line of symmetry
- How
- the vertical line through the minimum (or maximum) point
- On
maximum point ( curve)
- How
- the highest point
- On
- on :
| Read | How | On |
|---|---|---|
| for a given | up (or down) from to the curve, then across to the -axis | : |
| for a given | along the line to the curve, then down to the -axis | or |
| where it crosses the -axis | the points where | or |
| minimum point | the lowest point | |
| line of symmetry | the vertical line through the minimum (or maximum) point | |
| maximum point ( curve) | the highest point | on : |
📖 Worked example
The diagram shows the graph of . Use the graph to find the values of when .
Step 1 of 2
Draw the horizontal line y = 1 across the graph
The line meets the curve at two points.
📖 Worked example
The diagram shows the graph of . Write down the coordinates of the minimum point of the curve.
Step 1 of 1
The minimum point is the lowest point of the curve: read across first, then up or down
The minimum point is .
Your turn
Try one like these, checked as you answer, with hints if you need them. Free, no sign-up.
3. Cubic, reciprocal and exponential graphs
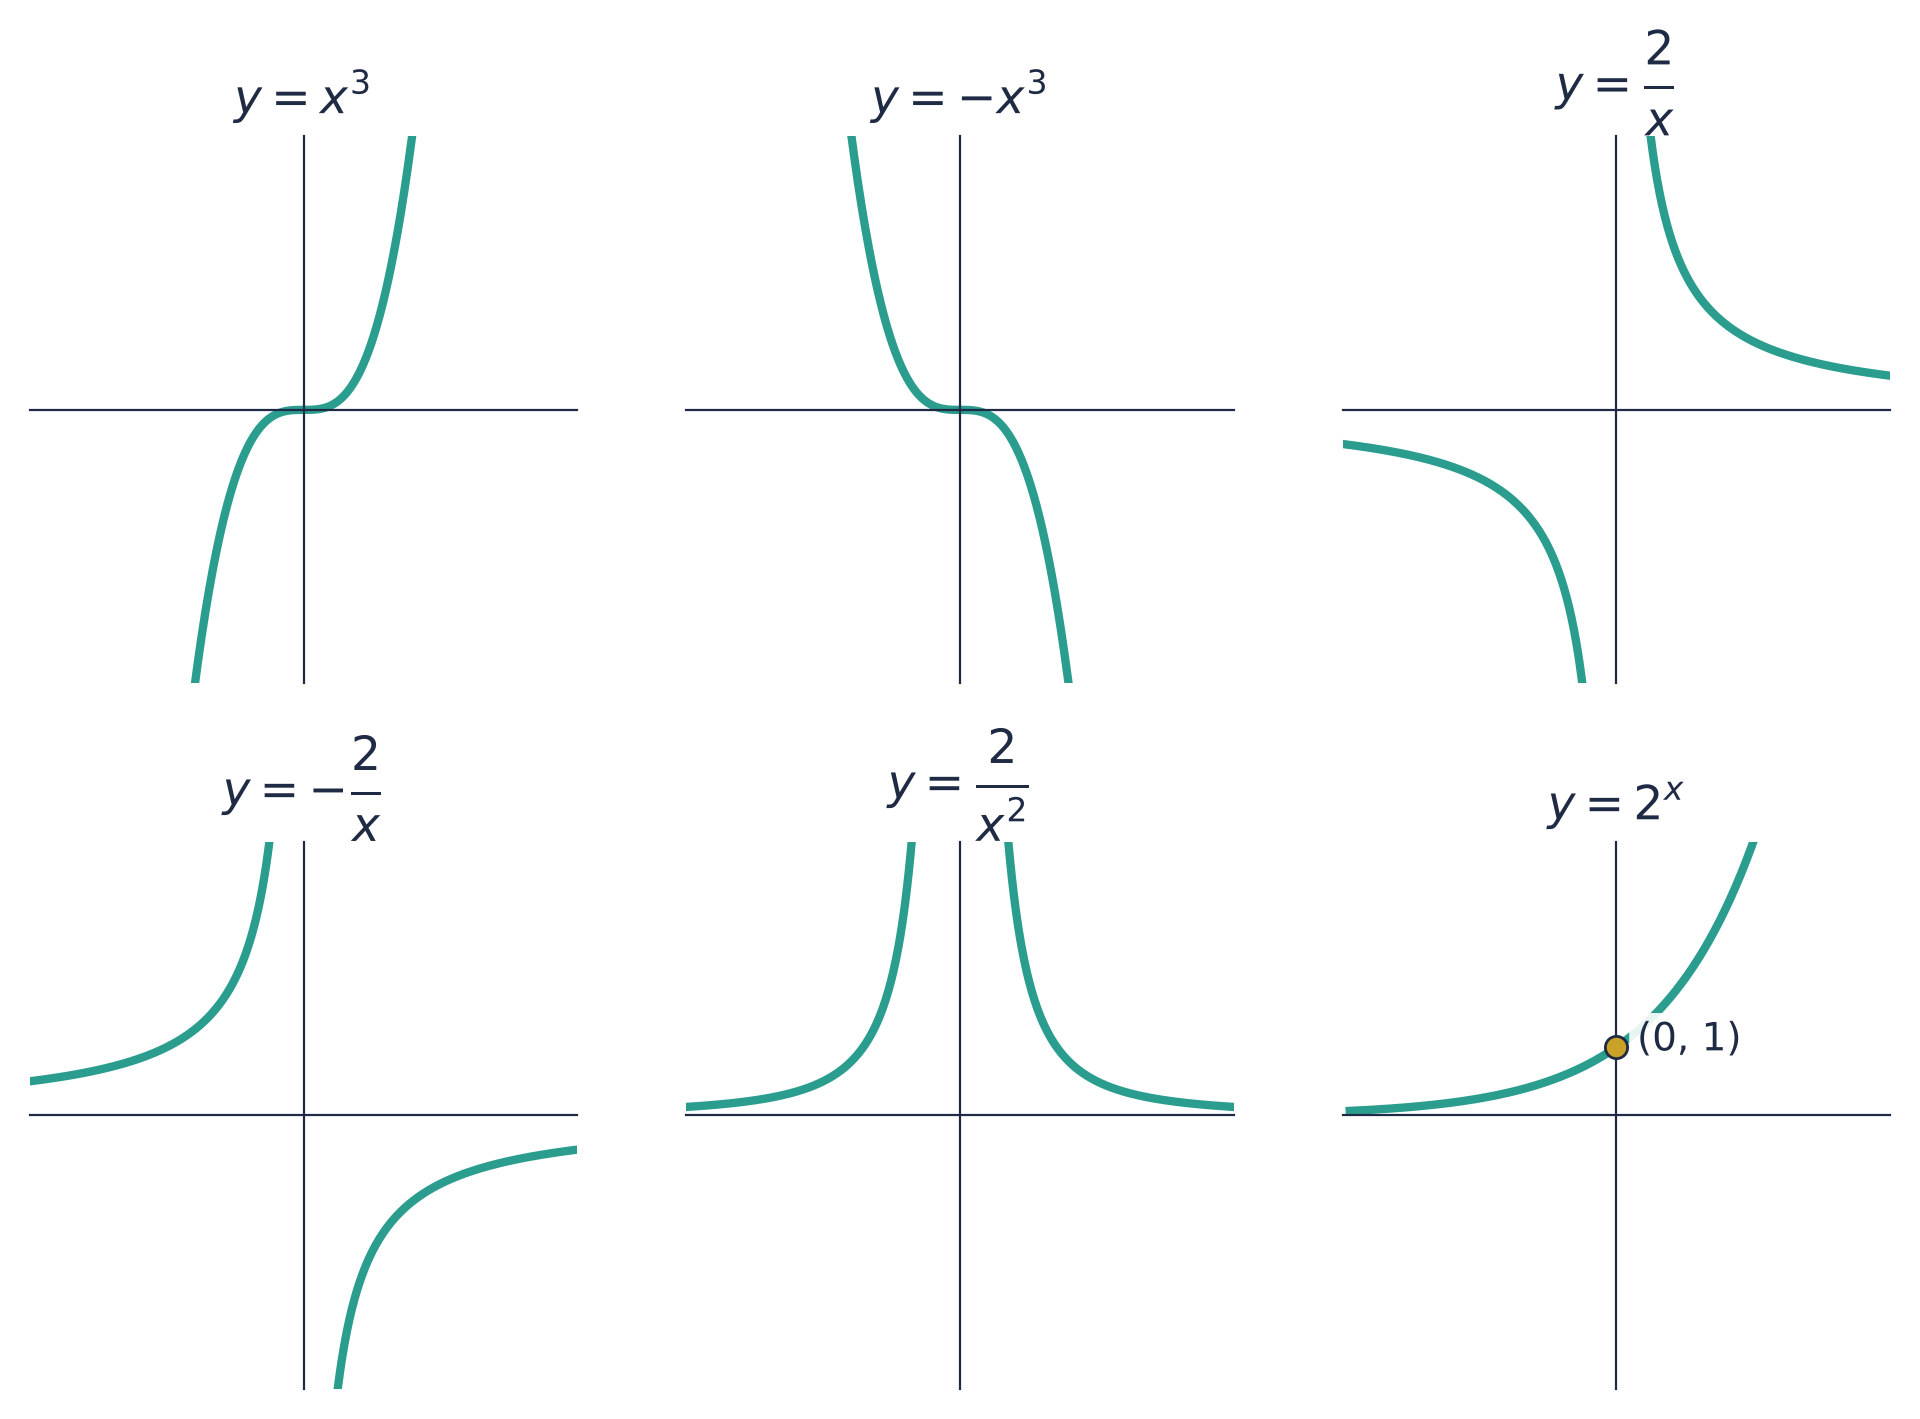
🎛️ Explore: drag the sliders or type the numbers
xyDrag the graph to move around.
- Type
- Asymptotes
- Branches
- : the branches are in the 1st and 3rd quadrants.
- The curve gets closer and closer to each asymptote but never touches it.
- : the whole graph moves neither up nor down.
Plot your own graph
Type with x, e.g. 2sin(3x) + 1, (x - 1)(x + 3), 1/x, 2^x, ln(x), sqrt(x). The axes fit what you draw.
- Shape
- : rises; : falls
- Shape
- up to two turning points; right-hand end goes up if , down if
- Shape
- two branches; never meets either axis
- Shape
- two branches, both on the same side of the -axis
- Shape
- crosses the -axis at ; never meets the -axis
| Graph | Shape |
|---|---|
| : rises; : falls | |
| up to two turning points; right-hand end goes up if , down if | |
| two branches; never meets either axis | |
| two branches, both on the same side of the -axis | |
| crosses the -axis at ; never meets the -axis |
Table of values: substitute each x
e.g.
Reciprocal
e.g.
Exponential
e.g.
A point on the curve: substitute to find k
e.g.
📖 Worked example
Given that , calculate the value of when , correct to 1 decimal place.
Step 1 of 2
Substitute the given value of x and work it out
📖 Worked example
The number of fish in a pond after months is . Find the number of fish after 2 months.
Step 1 of 2
Substitute the given value of t
More worked examples (2)
📖 Worked example
Which diagram, A, B, C or D, shows the graph of ?
Step 1 of 3
What type of graph is it?
is reciprocal ().
📖 Worked example
Water is poured at a constant rate into the empty container shown, which is open at the top. Which graph, A, B, C or D, shows how the depth of the water, cm, changes with time, seconds? (Each graph has going up and going across.)
Step 1 of 3
How does the container's width change going up?
The container gets narrower going up.
same width all the way up
- Depth against time
- a straight line
gets wider going up
- Depth against time
- rises quickly, then more slowly
gets narrower going up
- Depth against time
- rises slowly, then more quickly
wide part, then narrow part
- Depth against time
- two straight pieces: gentle, then steep
narrow part, then wide part
- Depth against time
- two straight pieces: steep, then gentle
| Water poured in steadily: container | Depth against time |
|---|---|
| same width all the way up | a straight line |
| gets wider going up | rises quickly, then more slowly |
| gets narrower going up | rises slowly, then more quickly |
| wide part, then narrow part | two straight pieces: gentle, then steep |
| narrow part, then wide part | two straight pieces: steep, then gentle |
Your turn
Try one like these, checked as you answer, with hints if you need them. Free, no sign-up.
4. Solving equations graphically
Where the curve meets the line
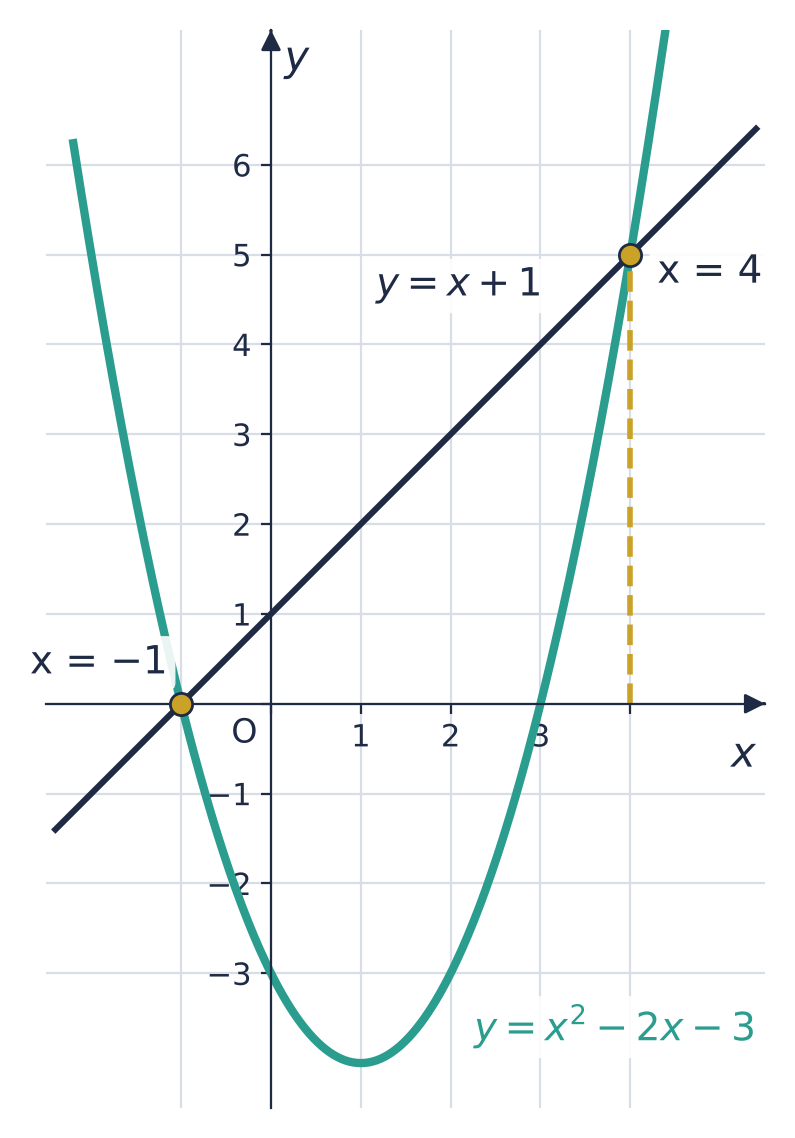
e.g.
Which line to draw: make the drawn curve one side
e.g.
- the curve is drawn, so draw
📖 Worked example
The diagram shows the graph of and the line . Use the graph to solve the equation .
Step 1 of 3
Each side of the equation is a graph
Left-hand side the curve
Right-hand side the horizontal line
📖 Worked example
The graph of has been drawn. Find the equation of the straight line that must be drawn on the same axes to solve the equation .
Step 1 of 3
Rearrange so the drawn curve is the left-hand side
A range of x: where the curve is below (or above) the line
e.g.
- the curve is below the line between the crossings:
above the maximum point, or below the minimum point
- Solutions of
through a turning point
- Solutions of
between the two turning points
- Solutions of
| The line (cubic with two turning points) | Solutions of |
|---|---|
| above the maximum point, or below the minimum point | |
| through a turning point | |
| between the two turning points |
More worked examples (2)
📖 Worked example
The diagram shows the graph of , and the straight line that must be drawn on the same axes to solve the equation . Use the graph to solve this equation.
Step 1 of 3
Rearrange so the drawn curve is the left-hand side
📖 Worked example
The diagram shows the graph of . Find the range of values of for which the equation has three solutions.
Step 1 of 2
Read the y-coordinates of the turning points
Maximum point
Minimum point
Your turn
Try one like these, checked as you answer, with hints if you need them. Free, no sign-up.
5. Tables of values: other powers of x
- At
- Watch
- a negative squared is positive
- At
- Watch
- keeps the sign of
- At
- Watch
- always the sign of the top
- At
- Watch
- a negative cubed stays negative
- At
- Watch
- a negative power is a fraction
| Term | At | Watch |
|---|---|---|
| a negative squared is positive | ||
| keeps the sign of | ||
| always the sign of the top | ||
| a negative cubed stays negative | ||
| a negative power is a fraction |
Work out each term, then add
e.g.
A root
e.g.
📖 Worked example
Complete the table of values for .
Step 1 of 1
Put each x into the equation. Square x first (a negative squared is positive), then divide into the number
When :
When :
When :
📖 Worked example
Complete the table of values for .
Step 1 of 1
Put each x into the equation. A negative power is a fraction: 2⁻¹ = ½ and 2⁻² = ¼; any number to the power 0 is 1
When :
When :
When :
Your turn
Try one like these, checked as you answer, with hints if you need them. Free, no sign-up.
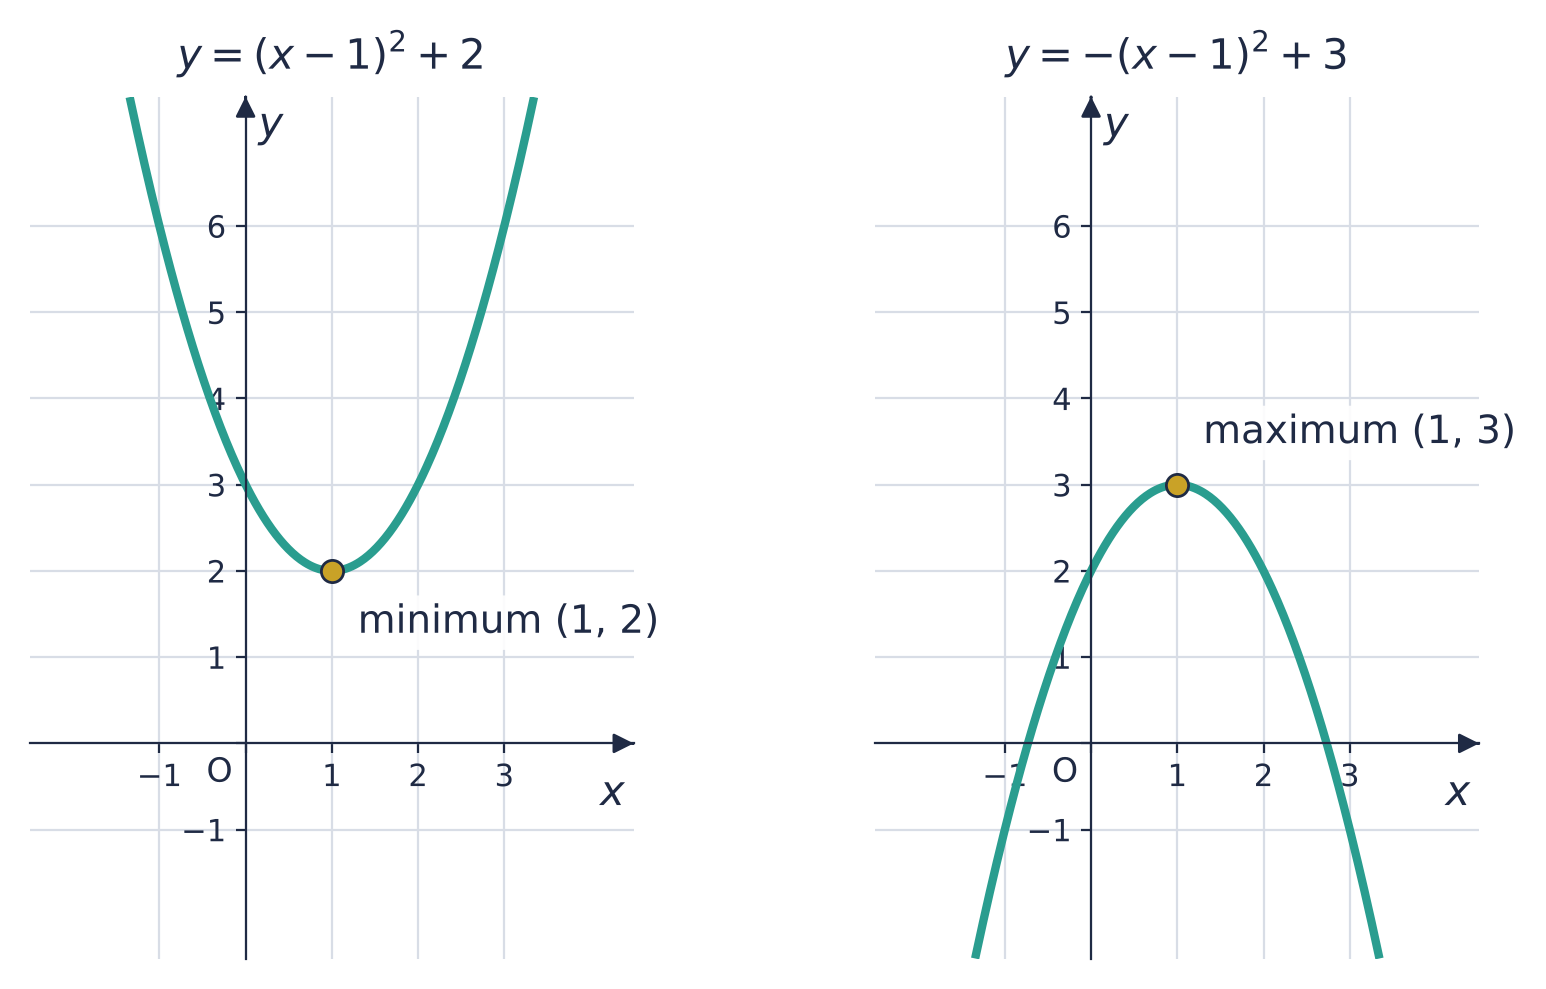
6. Graphs of quadratic functions
🎛️ Explore: drag the sliders or type the numbers
xyDrag the graph to move around.
- Crosses the x-axis at
- Crosses the y-axis at
- Minimum point
- Line of symmetry
- : a U shape (minimum point).
- : the curve crosses the -axis at .
- Changing slides the curve sideways and up or down together; the line of symmetry is .
Plot your own graph
Type with x, e.g. 2sin(3x) + 1, (x - 1)(x + 3), 1/x, 2^x, ln(x), sqrt(x). The axes fit what you draw.
-intercept
- How
-intercepts
- How
Line of symmetry
- How
Turning point
- How
| Feature | How | |
|---|---|---|
| -intercept | ||
| -intercepts | ||
| Line of symmetry | ||
| Turning point |
📖 Worked example
Find the -coordinates of the points where the curve meets the -axis.
Step 1 of 3
Which coordinate is 0 on the x-axis?
On the -axis, .
📖 Worked example
Find the coordinates of the turning point of the curve .
Step 1 of 2
Complete the square
Your turn
Try one like these, checked as you answer, with hints if you need them. Free, no sign-up.
7. Sketching cubic, reciprocal and exponential curves
- Shape
- cubic: up from the bottom left ( positive)
- Key points
- crosses the -axis at , ,
- Shape
- two branches
- Key points
- asymptotes and
,
- Shape
- rises ever faster
- Key points
- through , the -axis an asymptote
| Curve | Shape | Key points |
|---|---|---|
| cubic: up from the bottom left ( positive) | crosses the -axis at , , | |
| two branches | asymptotes and | |
| , | rises ever faster | through , the -axis an asymptote |
📖 Worked example
The diagram shows the graph of . Write down the -coordinates of the points where the graph crosses the -axis.
Step 1 of 1
The graph crosses the x-axis where y = 0: where one of the brackets is 0
📖 Worked example
The diagram shows the graph of . Write down the equation of its vertical asymptote.
Step 1 of 1
The vertical asymptote is where the bottom of the fraction is 0 (you can't divide by 0)
More worked examples (1)
📖 Worked example
The diagram shows the graph of , with its turning points marked. Find the range of values of for which the equation has exactly one solution.
Step 1 of 2
f(x) = k: where the horizontal line y = k meets the curve. Slide the line up and down
The turning points are at and : the number of crossings changes there.
Your turn
Try one like these, checked as you answer, with hints if you need them. Free, no sign-up.
Free account
What you get when you sign in
Everything on this page stays free. An account is where graphs of functions practice starts adding up.
- Endless questions on every chapter, at every level
- Your mistakes tracked by type, so you see what keeps costing marks
- Revision reminders before a topic fades
Start freeFree account. No card. Takes a minute.
Compare browsing and a free account
| Browsing | Account | |
|---|---|---|
| Read the notes and print worksheets and papers | ✓ | ✓ |
| Try a question with marking, hints and the step guide | ✓ | ✓ |
| Endless questions on every chapter, at every level | – | ✓ |
| Levels that unlock as you improve | – | ✓ |
| Your mistakes tracked by type, so you see what keeps costing marks | – | ✓ |
| WA practice papers on the chapters being tested | – | ✓ |
| Revision reminders before a topic fades | – | ✓ |
| Progress page and leaderboards | – | ✓ |