Loading…
IB Applications and interpretation · SL and HL
Statistics
Practise statistics with step-by-step help. Free account.
1. Mean, median and mode
mean
- Meaning
- Books read:
- , so
median
- Meaning
- the middle value, in order
- Books read:
- the 5th and 6th are both :
mode
- Meaning
- the most common value
- Books read:
| Average | Meaning | Books read: |
|---|---|---|
| mean | , so | |
| median | the middle value, in order | the 5th and 6th are both : |
| mode | the most common value |
Mean from a frequency table: Σfx ÷ Σf
e.g.
🎛️ Explore: drag the last value out and watch the averages
- In order
- Mean
- Median
- Mode
- Every value counts in the mean, so one far-out value pulls it a long way.
- The median only needs the middle of the order: moving the biggest value further out doesn't change it.
- So with an outlier (one value far from the rest), the median describes the data better.
📖 Worked example
The numbers of books read by 6 pupils last month are . The mean is . Find .
Step 1 of 3
Total of all the values = mean × number of values
Total
- Mean, median, mode
- Range
- unchanged
- Mean, median, mode
- Range
- unchanged
- Mean, median, mode
- Range
| Every value | Mean, median, mode | Range |
|---|---|---|
| unchanged | ||
| unchanged | ||
median
- When
- one value is far from the rest (it pulls the mean towards it)
mode
- When
- the most common item or size is wanted, or the data are not numbers
mean
- When
- every value should count and none is extreme
| Which average? | When |
|---|---|
| median | one value is far from the rest (it pulls the mean towards it) |
| mode | the most common item or size is wanted, or the data are not numbers |
| mean | every value should count and none is extreme |
📖 Worked example
The mean, median, mode and range of the marks scored by 12 pupils in a 10-mark quiz are marks, marks, marks and marks. Every mark is then multiplied by to give a mark out of . Find the new range.
Step 1 of 2
Every value changes as the question says: what happens to the range?
Multiplying every value by 2 multiplies every average AND the range by 2.
Every value is multiplied by , so the range is multiplied by .
More worked examples (2)
📖 Worked example
The list shows the monthly salaries, in dollars, of the 9 people working in a small company: . Which average, the mean, the median or the mode, is the most suitable to use to describe a typical value?
Step 1 of 3
Work out the mean and the median
Mean
3 s.f.
Median
📖 Worked example
Five whole numbers have a mode of , a median of , a mean of and a range of . Find the five numbers, from the smallest to the largest.
Step 1 of 4
Use the median: which number is it?
The 3rd number is the median, .
Your turn
Try one like these, checked as you answer, with hints if you need them. Free, no sign-up.
2. Grouped data
- Mid-value
- Frequency
- Mid-value
- Frequency
- Mid-value
- Frequency
- Mid-value
- Frequency
- Mid-value
- Frequency
Total
- Frequency
| Time (min) | Mid-value | Frequency | |
|---|---|---|---|
| Total |
Estimated mean: use the mid-values
e.g.
📖 Worked example
The table shows the distances some members of a cycling club rode on Sunday. Using the mid-value of each class, calculate an estimate of the mean, correct to 3 significant figures.
| Distance (d km) | Frequency |
|---|---|
| 12 | |
| 9 | |
| 6 | |
| 4 |
Step 1 of 4
Mid-value of each class: halfway between its ends
Mid-values
📖 Worked example
The table shows the masses of some parcels at a post office. Find the class that contains the median.
| Mass (m kg) | Frequency |
|---|---|
| 9 | |
| 7 | |
| 8 | |
| 4 | |
| 2 | |
| 11 |
Step 1 of 3
Total frequency: where is the middle?
Total frequency
The median is the th value.
Your turn
Try one like these, checked as you answer, with hints if you need them. Free, no sign-up.
3. Cumulative frequency
- Frequency
- Cumulative frequency
- Frequency
- Cumulative frequency
- Frequency
- Cumulative frequency
- Frequency
- Cumulative frequency
- Frequency
- Cumulative frequency
- Frequency
- Cumulative frequency
| Marks | Frequency | Cumulative frequency |
|---|---|---|
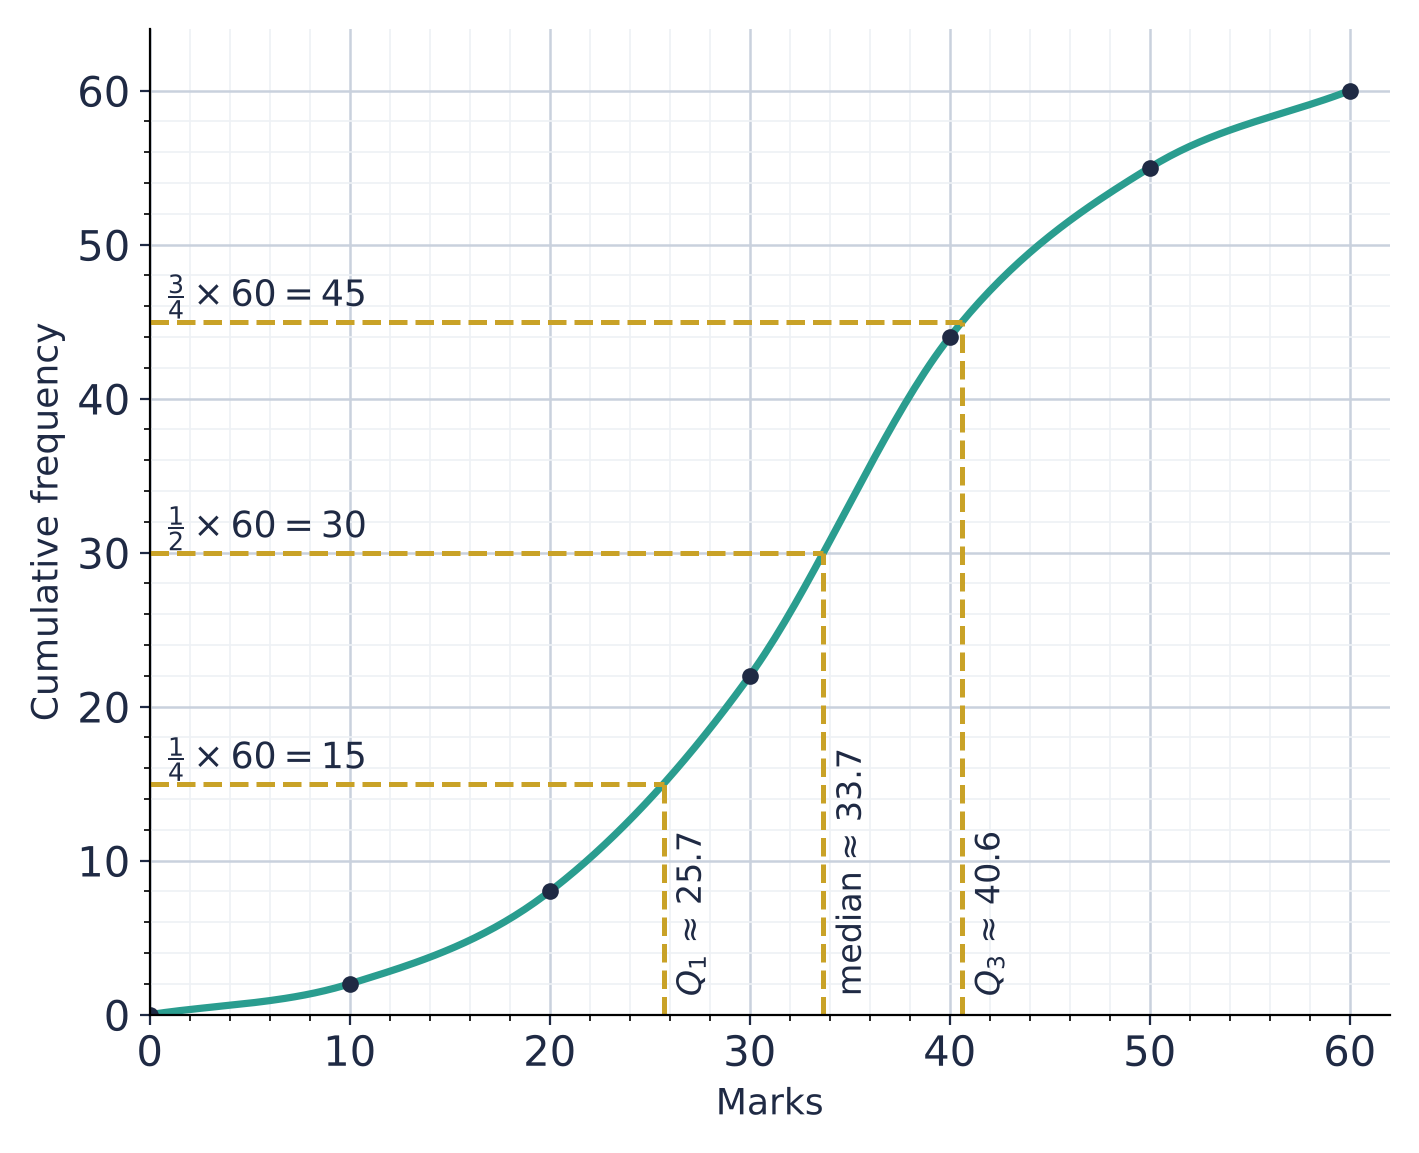
🎛️ Explore: read the curve
Up from , then across: about students scored at most marks
Interquartile range
- A count from a mark: up to the curve, then across to the cumulative frequency.
- A mark from a count (a quartile, a percentile): across to the curve, then down.
- The box plot underneath is the same three readings, with the lowest and highest possible marks at the ends.
📖 Worked example
The cumulative frequency curve shows the marks of students in a test. Use the curve to estimate the number of students who scored more than marks.
Step 1 of 3
Go up from the mark on the horizontal axis to the curve, then across
The curve gives about students with at most marks.
Your turn
Try one like these, checked as you answer, with hints if you need them. Free, no sign-up.
4. Median, quartiles and percentiles
lower quartile
- Read across from
- , so
- Here
median
- Read across from
- , so
- Here
upper quartile
- Read across from
- , so
- Here
interquartile range
- Read across from
- Here
th percentile
- Read across from
- Here
- 80th: across from
| From a curve ( values) | Read across from | Here |
|---|---|---|
| lower quartile | , so | |
| median | , so | |
| upper quartile | , so | |
| interquartile range | ||
| th percentile | 80th: across from |
From a list: 39, 42, 44, 46, 48, 50, 52, 55, 57, 61
- median: between the 5th and 6th, , so
- lower half :
- upper half :
📖 Worked example
The cumulative frequency curve shows the marks of students. Use the curve to estimate the median mark.
Step 1 of 2
Which cumulative frequency do you go across from?
percentage scoring or fewer
- On the curve
- up from , across: reading
with
- On the curve
- across from , then down
| Asked | On the curve |
|---|---|
| percentage scoring or fewer | up from , across: reading |
| with | across from , then down |
📖 Worked example
The cumulative frequency curve shows the marks of students. The probability that a student chosen at random scored more than marks is . Use the curve to estimate .
Step 1 of 4
Turn the probability into a number of students
More than marks: students
Your turn
Try one like these, checked as you answer, with hints if you need them. Free, no sign-up.
5. Box-and-whisker plots
range
- Formula
- max min
- Here
- , so
interquartile range
- Formula
- Here
- , so
| Measure | Formula | Here |
|---|---|---|
| range | max min | , so |
| interquartile range | , so |
📖 Worked example
The box-and-whisker plots show the times, in minutes, taken by two groups, and . Find the difference between their medians.
Step 1 of 2
Read each plot
: , , , ,
: , , , ,
📖 Worked example
The table gives some information about the times, in minutes, taken by a group of students to travel to school. On the scale, draw a box-and-whisker plot to show the information.
Step 1 of 1
Draw it above the scale
smallest value , lower quartile , median , upper quartile , largest value .
More worked examples (1)
📖 Worked example
The box-and-whisker plot shows the times, in minutes, that some students took to finish a task. of the students took less than minutes. Find the number of students who did the task.
Step 1 of 3
Read the plot: which of the five values is 20?
is the lower quartile, .
Your turn
Try one like these, checked as you answer, with hints if you need them. Free, no sign-up.
6. Mean and standard deviation
mean
- List
- Frequency table
standard deviation
- List
- Frequency table
or
- List
- Frequency table
| List | Frequency table | |
|---|---|---|
| mean | ||
| standard deviation | ||
| or |
30, 34, 35, 39, 42: Σx = 180, Σx² = 6566
e.g.
The same data, the other way: mean 36
e.g.
📖 Worked example
The table shows the marks of students. Using the mid-values of the classes, estimate the mean mark, correct to 3 significant figures.
| Marks, | Frequency |
|---|---|
| 2 | |
| 6 | |
| 14 | |
| 22 | |
| 11 | |
| 5 |
Step 1 of 2
Use the mid-values x with the frequencies f
or
- Mean
- or
- Standard deviation
- unchanged
- Mean
- Standard deviation
| Every value | Mean | Standard deviation |
|---|---|---|
| or | or | unchanged |
📖 Worked example
The mean and the standard deviation of the marks of a class in a test are marks and marks. Every student is then given extra marks for a question that was marked wrongly. Write down the new standard deviation.
Step 1 of 2
Every value changes as the question says: what happens to the standard deviation?
The standard deviation stays the same: moving every value by the same amount moves the mean, but the spread about it does not change.
Your turn
Try one like these, checked as you answer, with hints if you need them. Free, no sign-up.
7. Comparing two data sets
mean or median
- Meaning
- larger: the values are higher on average (say what that means, e.g. better marks, or took longer)
standard deviation or IQR
- Meaning
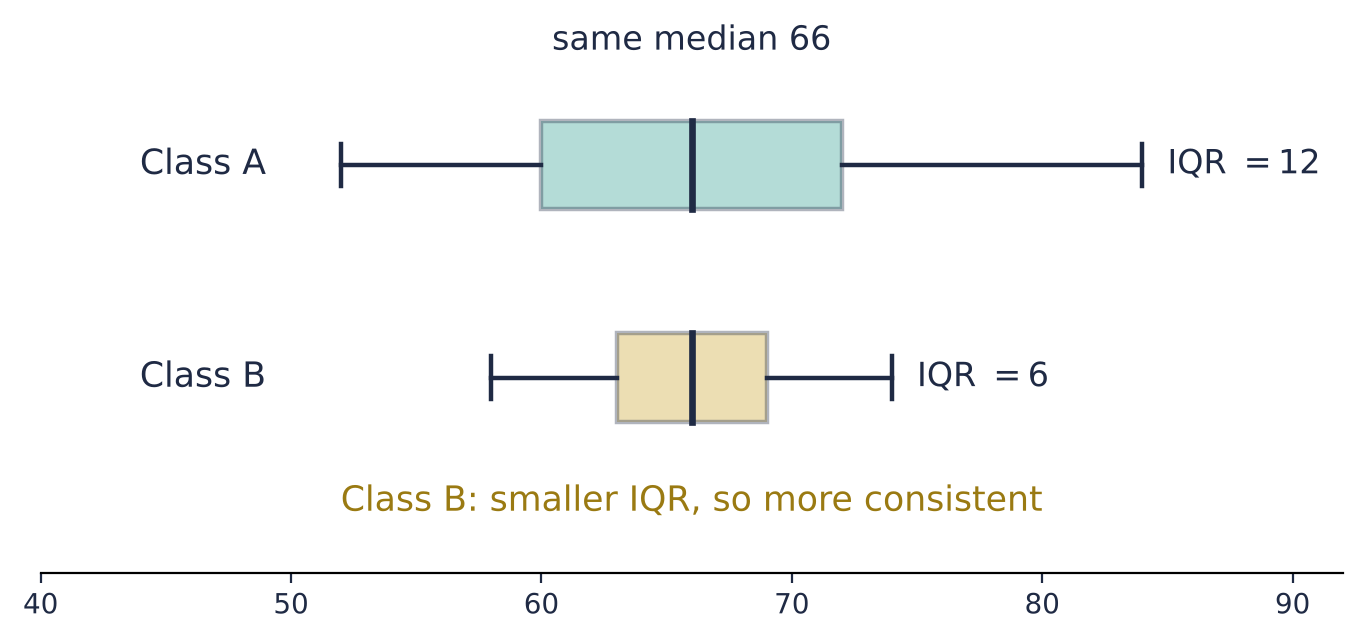
- smaller: more consistent (less spread out)
| Compare | Meaning |
|---|---|
| mean or median | larger: the values are higher on average (say what that means, e.g. better marks, or took longer) |
| standard deviation or IQR | smaller: more consistent (less spread out) |
📖 Worked example
The numbers of books read by some students in two classes are shown. Class : . Class : . Which class's numbers of books read were more consistent?
Step 1 of 4
Which measure answers the question?
More consistent means less spread: the smaller standard deviation.
Your turn
Try one like these, checked as you answer, with hints if you need them. Free, no sign-up.
8. The χ² test
Expected frequency
e.g.
Statistic
Degrees of freedom
- goodness of fit: categories
-value significance level
- Conclusion
- reject
-value significance level
- Conclusion
- do not reject
| Conclusion | |
|---|---|
| -value significance level | reject |
| -value significance level | do not reject |
📖 Worked example
The table shows students' favourite sport, by year group. A test for independence is used to test whether year group and favourite sport are independent. Find the expected frequency for the cell Year 12, Football.
| Football | Basketball | Tennis | |
|---|---|---|---|
| Year 12 | |||
| Year 13 |
Step 1 of 2
The row total, the column total and the grand total
Row
Column
Grand total
Your turn
Try one like these, checked as you answer, with hints if you need them. Free, no sign-up.
9. Sampling and data
Simple random
- How
- every member equally likely
Systematic
- How
- every th member, random start
Stratified
- How
- random from each group, in proportion
Quota
- How
- a set number from each group, not random
Convenience
- How
- whoever is easiest to reach
| Method | How |
|---|---|
| Simple random | every member equally likely |
| Systematic | every th member, random start |
| Stratified | random from each group, in proportion |
| Quota | a set number from each group, not random |
| Convenience | whoever is easiest to reach |
Stratified share
e.g.
Outliers
📖 Worked example
A population of people: are in Year 10, are in Year 11 and are in Year 12. A stratified sample of is taken. How many of the sample are in Year 10?
Step 1 of 1
The group's share of the sample: its share of the population
Your turn
Try one like these, checked as you answer, with hints if you need them. Free, no sign-up.
10. Hypothesis tests
increased, more
decreased, less
changed, different
| Claim | |
|---|---|
| increased, more | |
| decreased, less | |
| changed, different |
p-value
- reject if the p-value is less than the significance level
t statistic
Type I error
- Type II: not rejecting when it is false
Your turn
Try one like these, checked as you answer, with hints if you need them. Free, no sign-up.
11. Reliability, validity and classes for χ²
test–retest
- Checks
- reliability
- How
- the same test again later
parallel forms
- Checks
- reliability
- How
- an equivalent second version
content
- Checks
- validity
- How
- covers everything it should
criterion-related
- Checks
- validity
- How
- agrees with an established measure
| Test | Checks | How |
|---|---|---|
| test–retest | reliability | the same test again later |
| parallel forms | reliability | an equivalent second version |
| content | validity | covers everything it should |
| criterion-related | validity | agrees with an established measure |
📖 Worked example
A goodness of fit test is used to see whether observations of fit a Poisson distribution with mean . The expected frequencies are: Classes with an expected frequency less than are combined with a neighbouring class. Find the number of degrees of freedom.
Step 1 of 2
Combine each class below 5 with its neighbour
Classes: , , ,
Your turn
Try one like these, checked as you answer, with hints if you need them. Free, no sign-up.
Free account
What you get when you sign in
Everything on this page stays free. An account is where statistics practice starts adding up.
- Endless questions on every chapter, at every level
- Your mistakes tracked by type, so you see what keeps costing marks
- Revision reminders before a topic fades
Start freeFree account. No card. Takes a minute.
Compare browsing and a free account
| Browsing | Account | |
|---|---|---|
| Read the notes and print worksheets and papers | ✓ | ✓ |
| Try a question with marking, hints and the step guide | ✓ | ✓ |
| Endless questions on every chapter, at every level | – | ✓ |
| Levels that unlock as you improve | – | ✓ |
| Your mistakes tracked by type, so you see what keeps costing marks | – | ✓ |
| WA practice papers on the chapters being tested | – | ✓ |
| Revision reminders before a topic fades | – | ✓ |
| Progress page and leaderboards | – | ✓ |